Financial statement analysis is the process of evaluating a company’s financial information in order to make informed economic decisions. It involves the review and analysis of income statements, balance sheets, cash flow statements, statements of shareholders’ equity, and any other relevant financial statements.
Financial statement analysis is an essential tool that is used by analysts, investors and internal decision makers to better understand a company’s financial position, performance, and growth potential. In this article, you’ll learn how to analyze a financial statement using real-world financial statement analysis examples.
The Three Essential Financial Statements
In order to perform a financial statement analysis, you’ll need to refer to three essential financial statements: balance sheet, income statement, and cash flow statement.
1. The Balance Sheet
The balance sheet (also called the statement of financial position), provides insight into a company's financial position at a given date. On this financial statement, you'll find an overview of the company's assets, liabilities, and shareholders' equity. These sections highlight the value of what the company has to work with, what it owes, and what is owned by shareholders.
2. The Income Statement
The income statement (often called a profit and loss statement) provides an overview of a company’s revenues, expenses, gains, and losses over a given period. This financial statement is often used to analyze a company’s financial position, operations, efficiency, and performance in relation to competitors in its industry.
3. The Cash Flow Statement
The cash flow statement (also called the statement of cash flows) summarizes a company’s cash inflows and outflows over a given period. It identifies the company’s sources and uses for its cash (e.g. operations, investments, financing), which helps to measure how well the company manages its cash position.
Financial Statement Analysis Example for a Balance Sheet
Balance sheets are important financial statements that offer valuable insights into a company’s financial position at a specific point in time.
A balance sheet analysis provides insight into a company’s financial position - value of assets owned, amount of money owed, etc. - at a specific point in time. This information helps analysts, investors, and decision-makers gauge the potential profitability of investing in that company.
What to Look for on the Balance Sheet
During a balance sheet analysis, there are a number of important items to pay attention to under assets, liabilities, and shareholders’ equity.
Assets
The assets section covers all economic resources owned by a company. While this section is important as a whole, there are a few particular items that warrant extra attention:
Cash
Cash can be a good indicator of a company’s ability to generate sales, get paid, and manage its purchases and debt obligations. The amount of cash on a company’s balance sheet can also reveal how well it could handle an unexpected downturn or repay immediate debts.
However, it’s important to note that some businesses don’t rely on a significant amount of cash to operate, instead choosing to reinvest cash to increase their future earnings potential.
Accounts Receivable
Accounts receivable provides insight into a company’s ability to collect the money it is owed. If sales remain steady or grow and accounts receivable decreases each year (compared to previous years), the company is likely doing a good job at collecting its money. On the other hand, if accounts receivable increases each year, the company may not be collecting its payments efficiently.
Inventory
The inventory section on a balance sheet details a company’s raw materials, works in progress, and completed inventory. This information is essential for measuring cost of goods sold (COGS), inventory turnover rate, days inventory outstanding, and other metrics that are used to evaluate operational efficiency and profitability. However, this section merely highlights the value of a company’s inventory without consideration for things such as obsolescence, spoilage, and shrinkage.
Liabilities
The liabilities section summarizes all of the financial obligations a company has to outside parties. Investors generally prefer companies that have fewer liabilities than assets, but there are a few other important things to look out for:
Accounts Payable
The accounts payable section summarizes the amount of money a company owes to its vendors or suppliers. It includes short-term debts for products or services rendered such as inventory, utility bills, and other invoices.
Accounts payable is important to analysts and investors because it helps them understand how a company balances credit and cash purchases, how long it takes to pay its bills, and how much money is earmarked for its short-term debt obligations.
Short-term Debt
The short-term debt/current liability account details the total amount of debt that a company must repay within the next 12 months. It includes items such as accounts payable, salaries owed, taxes to be paid, short-term loans, lease payments, and more.
These debts are incurred in relation to a company’s primary business activities and are often referred to as operating debts. This section is an important consideration for analysts, creditors, and investors as it used to gauge a company’s liquidity and ability to meet short-term financial obligations.
Long-term Debt
The long-term debt section summarizes a company’s outstanding debts due at least 12 months in the future. It includes items such as loans, mortgages, bonds, lease obligations, and more.
Long-term debts are generally incurred through activities related to raising capital and are often referred to as financing debt. The long-term debt section is important for analysts and investors as it helps them understand a company’s long-term financial commitments, capital structure, and leverage.
Shareholders’ Equity
The shareholders’ equity section represents the total value of the company that is available to shareholders after all debts have been paid. Therefore, the value of shareholders’ equity is the equivalent of the company’s assets less its liabilities.
In the event of liquidation, equity owners receive payments after debt holders, making this section important for analysts and investors.
Retained Earnings
The retained earnings section highlights the amount of accumulated income that is left over after distributing dividends to shareholders. This money is kept by the company and reinvested, held as cash, or used to reduce liabilities.

The resulting value can be positive or negative, representing how the company managed its profits. It is important for analysts, investors, and lenders because it provides insight into the company’s financial stability, how it handles future growth, and how it manages its cash flow.
Paid-in Capital
The paid-in capital section summarizes the amount of money a company generates from selling stock directly to investors. It includes funds received from the direct sale of common stock or preferred stock. It does not include exchanges between investors on the secondary market.
The section also includes additional paid-in capital (which is the amount of money investors paid for stock beyond its par value). A high level of paid-in capital indicates significant interest or confidence in the company, which makes it a useful indicator for analysts and investors.
5 Important Balance Sheet Financial Ratios
After analyzing the sections mentioned above, use financial ratios to extract deeper insights from a company’s balance sheet. These useful tools can help you transform raw data into information about liquidity, efficiency, and more.
1. Current Ratio
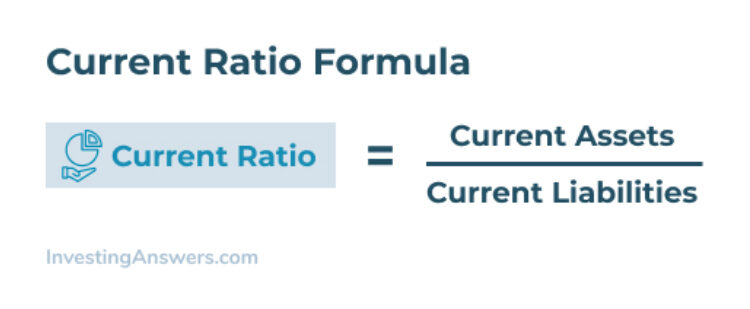
The current ratio (also called the working capital ratio) measures a company's ability to meet its short-term debt obligations using its current assets. It indicates how many times current liabilities can be covered by current assets, making it an effective measure of a company's liquidity.
How to Calculate Current Ratio
2. Quick Ratio
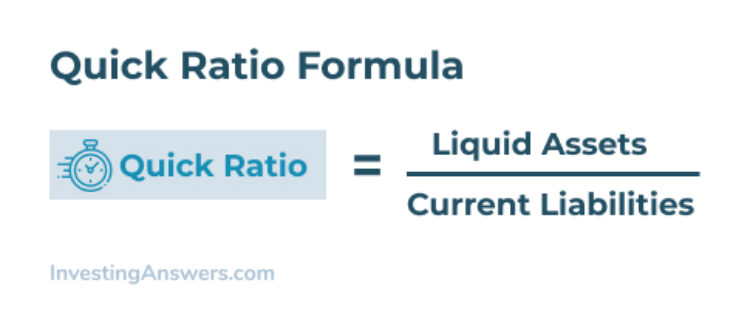
Also called the acid-test ratio, the quick ratio gauges a company's ability to cover its current liabilities using only its most liquid assets. It indicates how many times the company's current liabilities can be covered by its most liquid assets such as cash, cash equivalents, and marketable securities.
Quick Ratio Formula
3. Cash Ratio
The cash ratio measures a company’s ability to pay its current liabilities using only its cash and cash equivalents. Expressed as a value, the cash ratio indicates how many times the company’s cash and cash equivalents can cover its current liabilities.
Cash Ratio Formula

4. Price-to-Book Ratio
The price-to-book ratio measures a company's share price relative to its book value, revealing the price investors must pay for each dollar of book value.
How to Calculate Price-to-Book Ratio

The resulting value is used for comparisons against other companies and industries.
5. Debt Ratio
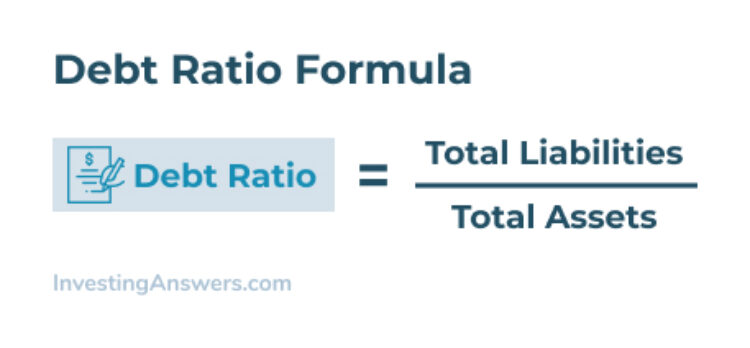
The debt ratio measures a company’s debt relative to its assets, providing valuable insights into how assets are funded and the degree to which its assets can be used to cover financial obligations.
Debt Ratio Formula
How to Analyze Debt Ratio
A value greater than one indicates that the company has more debt than assets, where a value less than one indicates that it has more assets than debt.
The Balance Sheet Equation
The balance sheet equation states that the left side (assets) and right side (liabilities + shareholders' equity) of a balance sheet will be equal or 'in balance'. This is the case because the company’s assets have been financed through either debt or equity, so assets = debt + equity.
Balance Sheet Example
You can use the information from the balance sheet to analyze different aspects of a company. All of the information is easily accessible, so it’s up to you to read through the sections that are important to your analysis and/or calculate financial ratios based on the data.
The following balance sheet example shows information for two consecutive years, allowing you to track performance over time and compare data between years.
.jpg)
Financial Statement Analysis Example for the Income Statement
An income statement provides insight into a company's revenues, expenses, gains, and losses in a given period. This information is particularly useful for investors and analysts as it can help them track a company’s performance, profitability, efficiency, and more.
There are a few particular sections to pay extra attention to:
Net Income
Also called net earnings, net income is one of the most important lines on the income statement. This highlights the amount of profit or loss the company generated over the specified period. It is one of the most common indicators of a company’s profitability, making it extremely useful for analysts and investors. Net income can also be used to make other calculations, such as earnings per share, net profit margin, and retained earnings.
The Easiest Way to Find Net Income
Net income (“the bottom line”) is one of the most important bits of information on an income statement as it highlights the amount a company earns after accounting for expenses. In other words, it is the profit or loss generated over a specific period.
Net income can always be found on the last line of the income statement, but you can also can also calculate net income using the following formula:
.jpg)
Operating Expenses
The operating expenses section summarizes all expenses incurred through regular business activities such as rent, payroll, inventory costs, marketing, administrative fees. It highlights the amount of money required to operate the company.
The operating expenses section directly affects the company’s bottom line and is also used to calculate its operating income. It also provides insight into cost efficiency and profitability, which is especially important to analysts and investors.
Gross Profit
The gross profit highlights the amount of revenue generated from sales (minus the costs incurred to achieve those sales). In other words, it shows how much profit a company makes after accounting for the cost of goods sold.
The gross profit represents revenues net of costs such as materials, labor, transaction fees, equipment, and shipping, but before deducting for operating expenses such as marketing costs, administrative fees, etc. This section is important to analysts and investors because it is used to measure a company’s efficiency of converting production inputs (e.g. labor, materials) into finished products (e.g. goods, services).
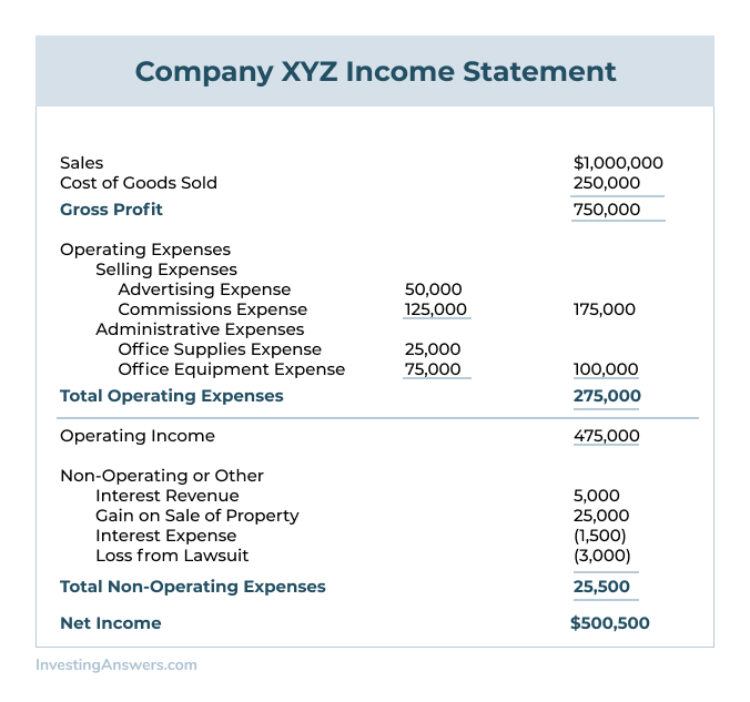
Income Statement Example
The Securities and Exchange Commission (SEC) requires public companies to publish income statements at the end of each quarter, making it easy to access the information you need for your financial statement analysis.
5 Important Income Statement Financial Ratios
Just like the balance sheet, there are important financial ratios that can be calculated using information from the income statement. Here are some examples:
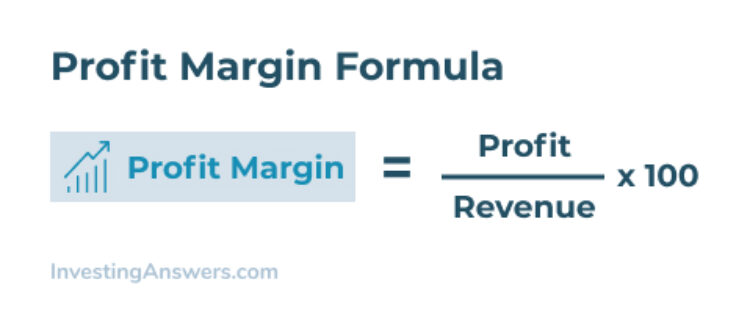
1. Profit Margin
Profit margin is one of the most important financial ratios for analysts and investors as it measures a company’s profitability. Averages can vary between companies and industries. As a rule of thumb, a 5% profit margin is low, 10% is average, and 20% is good.
Profit Margin Formula
2. Debt Service Coverage Ratio (DSCR)
The debt service coverage ratio is frequently used by analysts and investors to assess a company’s credit risk and debt capacity. A value greater than one means that the company has enough operating income to cover its short-term debt obligations at least once, whereas a number less than one means that it does not.
Debt Service Coverage Ratio Formula

3. Price-to-Earnings Ratio
The price-to-earnings (P/E) ratio is another popular financial ratio that is used to determine whether a company’s share price is undervalued, overvalued, or fairly priced. While there is no benchmark for what makes a 'good' P/E ratio, a higher value can indicate that a stock is overvalued, whereas a lower value can indicate that it is undervalued.
How To Calculate Price-To-Earnings Ratio

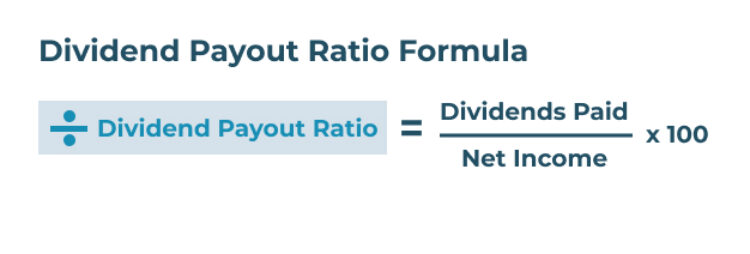
4. Dividend Payout Ratio
The dividend payout ratio is a useful metric that measures the amount of dividends a company pays to its shareholders in relation to its net income.
This metric is useful for analysts and investors because it provides insight into a company’s earnings stability and approach to future growth. Ratios can vary between companies and industries, but generally speaking, well-established companies have higher dividend payout ratios while younger companies have lower ratios as they reinvest more of their earnings.
How To Calculate Dividend Payout Ratio
5. Dividend Yield
Dividend yield measures a company's annual dividend payout in relation to its stock price. It highlights the value of dividends that shareholders receive for each dollar of company stock they own. It is useful for measuring return on investment, especially for investors who prioritize dividend payouts over capital gains.
How to Calculate Dividend Yield

Financial Statement Analysis Example for The Cash Flow Statement
The cash flow statement measures a company's liquidity, solvency, turnover, and financial health, so it's an important consideration when doing a thorough financial statement analysis.
The cash flow statement provides an overview of how a company generates and spends cash over a given period. It breaks down company cash activities into three categories: operating activities, investing activities, and financing activities, which can help investors and analysts understand how the company manages its cash and generates revenue.
What to Look for on The Cash Flow Statement
The cash flow statement presents useful information about a company’s cash inflows and outflows, broken down into three categories. Here’s what to look for:
Operating Activities
The operating activities section summarizes all cash inflows and outflows resulting from regular business activities. It is generally the primary source of a company's cash and is therefore often considered the most important section on the cash flow statement. A positive (inflows greater than outflows) cash flow from operating activities can indicate that the company’s operation is in good financial health.
Investing Activities
The investing activities section covers all cash inflows and outflows resulting from a company’s investments: the purchase or sale of assets and loans lent out and repaid, , as well as payments for business acquisitions.
This section is generally composed of cash outflows (since cash is being spent to purchase investments), but cash inflows will occur when the company divests and receives cash for the sale of an investment.
Every company handles investing activities differently, so it is difficult to gauge financial health on this section alone. However, purchases of equipment, property, and other assets are generally a good sign as they indicate that a company is healthy enough to invest in future growth.
Financing Activities
Financing activities include any cash inflows or outflows involving debt, equity, and dividends. In other words, it summarizes all transactions related to funding the company. It highlights the movement of cash between the company and its owners, investors, lenders, and creditors, and provides insight into how borrowing affects company cash flow.
A positive cash flow from financing activities means that the company has received cash (for example, issuing stock), whereas a negative cash flow indicates that it has paid out cash (for example, making dividend payments).
Bottom Line
The last line on a cash flow statement, the bottom line indicates whether the company had a positive or negative net cash flow for the given period. It is calculated by adding the cash flows from the company’s operating, investing, and financing activities. When the net cash flow is added to the company’s beginning cash, the resulting value indicates how much cash the company has available at the end of the year.
How To Find Net Increase Or Net Decrease
To find the net increase/decrease in cash and cash equivalents over the given period use the formula given below:
.jpg)
Cash Flow Statement Example
Now that you know how a cash flow statement works – and what to look for during your analysis – you can use the cash flow statement example below to get started:
.jpg)
Remember: Financial Statement Analysis Isn’t an Exact Science
Financial statement analysis is a great way to make more informed decisions, but it’s not an exact science. Accounting methods can vary, numbers can be based on projections, and important factors (such as management quality) are not taken into account. Therefore, financial statement analysis doesn’t always show the full picture.
The main value comes from the data found on these financial statements, which can be used to calculate financial ratios, make comparisons to competitors, and/or track performance over time.
This is especially true for beginner investors who may not be familiar with each of the statements, industry averages, implications from the analysis, and so on. It’s important to do your own initial research, but consider hiring a professional before making any serious investment decisions.


