What the Top Financial Ratios Offer Investors and Analysts
Key financial ratios allow analysts and investors to convert raw data (from financial statements) into concise, actionable information. This information is used to used to:
- evaluate performance
- compare companies and industries
- conduct fundamental analysis
Even though there are plenty of important financial ratios out there, investors only tend to focus on a handful of them. From profitability to liquidity, leverage, market, and activity, these are the 20 most important ratios for financial analysis.
Profitability Ratios
Profitability ratios measure a company’s ability to generate earnings (profit) in relation to its revenue, operating costs, shareholders’ equity, and balance sheet assets. In other words, these useful financial ratios reflect how well a company can convert its resources and assets into income.
1) Return on Assets (ROA)
Return on assets measures a company’s ability to generate income from its assets. Expressed as a percentage, this common financial ratio indicates how much profit can be derived from each dollar of assets owned by the company.
How to Calculate Return on Assets
You can calculate ROA by dividing net income by total assets, then multiplying by 100:

Return on Assets Example
Let’s assume that Company A reported $10,000 of net income and owns $100,000 in assets. In this situation, its ROA can be calculated as follows:

Based on this calculation, we can conclude that Company A’s return on assets is 10%. For every $1 of assets it owns, it can generate $0.10 in profit.
What Is a Good ROA?
In general, an ROA above 5% is considered good. A higher ROA is better, as it indicates that the company can generate more income from each dollar of assets.
2) Return on Equity (ROE)
Return on equity measures a company’s ability to generate earnings in relation to its shareholders’ equity. Expressed as a percentage, this financial ratio indicates how much profit is generated for each dollar of shareholders’ equity.
How to Calculate Return on Equity
You can calculate ROE by dividing net income by shareholders’ equity, then multiplying by 10:

Return on Equity Example
Let’s assume that Company B reported $10,000 of net income and its shareholders have $200,000 in equity. In this situation, its ROE can be calculated as follows:
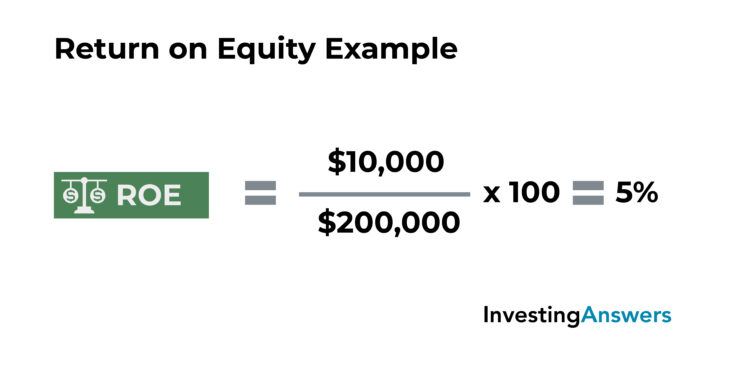
Based on this calculation, we can conclude that Company B’s return on equity is 5%. In other words, for every $1 of shareholders’ equity, it can generate $0.05 in profit.
What Is a Good ROE?
While averages can vary depending on the industry, an ROE above 10% is generally considered good. A higher number is better, as it indicates that the company can generate more income from each dollar of shareholders’ equity.
3) Profit Margin
Profit margin is one of the most useful ratios to evaluate a company's profitability. Expressed as a percentage, it measures a company’s earnings in relation to its revenue. In other words, it indicates how much profit is earned from each dollar of sales.
Profit Margin Formula
You can calculate profit margin by dividing profit (also called net income) by revenue (also called net sales), then multiplying by 100.

Profit Margin Example
Let’s assume that Company C reported $100,000 of profit on $500,000 of revenue. Its profit margin can be calculated as follows:
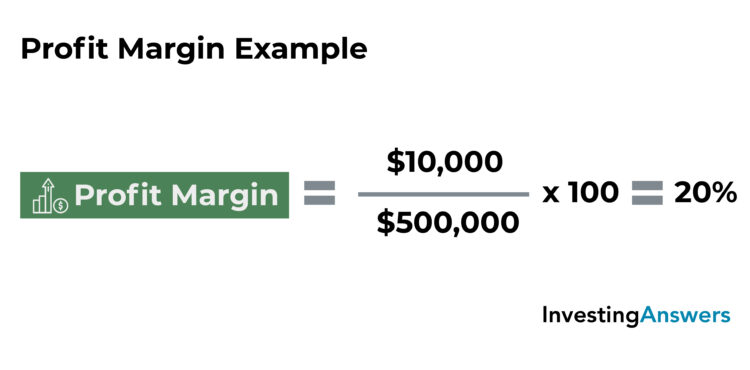
Based on this calculation, we can conclude that Company C’s profit margin is 20%. This means that it generates $0.20 of profit for every $1 of sales.
What Is a Good Profit Margin?
For profit margin, a higher number is better, as it indicates that the company makes more profit on each sale. Averages vary significantly between industries, but generally speaking: A profit margin of 5% is low, 10% is average, and 20% is good.
Liquidity Ratios
Liquidity ratios measure a company’s ability to meet short-term debt obligations without raising additional capital. These important financial ratios can be used for internal analysis to gauge economic health. They can also be used for external analysis to compare against other companies or industries.
Dividing cash and other assets by current liabilities indicatew the number of times that a company can use cash and other assets to cover its obligations. The higher the value, the better the financial health of the company.
More simply, if the value is greater than 1, the short-term debt obligations are fully covered. If the value is less than 1, short-term debt obligations aren’t covered.
4) Current Ratio
Also called the working capital ratio, the current ratio measures a company’s ability to cover its current liabilities (debts due within one year) by using its current assets. Expressed as a numerical value, this important financial ratio indicates how many times current liabilities can be covered by current assets.
How to Calculate Current Ratio
The current ratio is calculated by dividing current assets by current liabilities.

Current Ratio Example
Let’s assume that Company D holds $100,000 in current assets and has $50,000 in current liabilities. This current ratio can be calculated as follows:
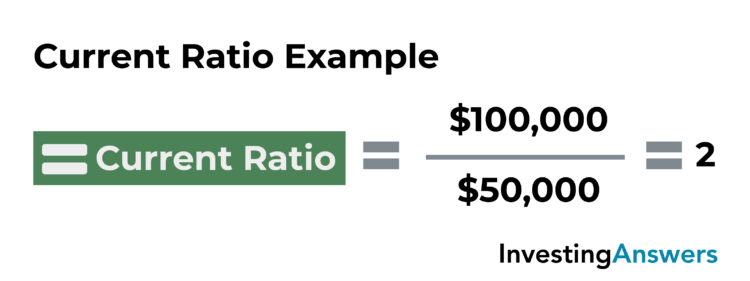
Based on this calculation, we can conclude that Company D has a current ratio of 2, meaning that its current liabilities can be covered twice by its current assets.
What Is a Good Current Ratio?
Since industry averages can vary and current ratios can fluctuate, it’s difficult to set a benchmark for what a “good” current ratio is. However, a ratio above 1 indicates that the company has more current assets than current liabilities, whereas a ratio below 1 indicates that the company has more current liabilities than current assets.
5) Quick Ratio
Also known as the acid-test ratio, the quick ratio measures a company’s immediate ability to cover its current liabilities with its most liquid assets (e.g. cash, cash equivalents, marketable securities, accounts receivable). While similar to the current ratio, it excludes inventory and prepaid expenses since they can take weeks or months to turn into cash.
Quick Ratio Formula
Expressed as a numerical value, this key financial ratio indicates how many times a company’s current liabilities can be covered by its most liquid assets. It is calculated by dividing liquid assets by current liabilities.

Example of Quick Ratio
Let’s assume that Company E holds $50,000 in liquid assets and has $50,000 in current liabilities. In this situation, its quick ratio can be calculated as follows:
.jpg)
Based on this calculation, we can conclude that Company E has a quick ratio of 1, which means that its liquid assets cover its current liabilities 1 time.
What's a Good Quick Ratio?
A value above 1 indicates that the company can immediately pay off its current liabilities using its liquid assets. A value below 1 indicates that it cannot.
6) Cash Ratio
The cash ratio measures a company’s ability to cover its current liabilities using only its cash and cash equivalents. Expressed as a numerical value, this standard financial ratio indicates how many times a company’s short-term debt obligations (current liabilities) can be covered by its cash and cash equivalents, such as marketable securities.
The Cash Ratio Formula
To find the cash ratio, divide cash and cash equivalents by current liabilities.

Example of Cash Ratio
Let’s assume that Company F holds $25,000 in cash and cash equivalents and has $50,000 in current liabilities. In this situation:
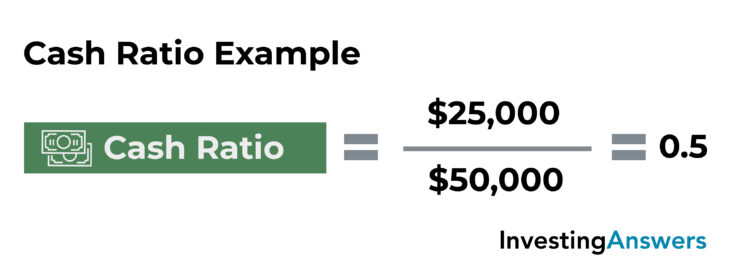
Based on this calculation, we can conclude that Company F has a cash ratio of 0.5, meaning that its cash and cash equivalents only cover half of its current liabilities.
What Is a Good Cash Ratio?
A cash ratio above 1 indicates that the company can immediately pay its current liabilities in cash. A cash ratio below 1 indicates that the company cannot.
Leverage Ratios
Leverage ratios measure the amount of debt a company incurs in relation to its equity and assets. These are some of the most important ratios for financial analysis and provide important information about the company’s capital structure, its ability to meet financial obligations, and how it uses debt to finance its operations.
7) Debt Ratio
The debt ratio is a measure of a company’s debt in relation to its assets. It indicates the percentage of the company’s assets that are funded by debt – and the degree to which its assets could be used to cover its debts. It is calculated by dividing total liabilities by total assets.
A value greater than 1 indicates that the company has more debt than assets, whereas a value less than 1 indicates that the company has more assets than debt. A higher value indicates a greater amount of leverage.
Debt Ratio Formula

Debt Ratio Example
Let’s assume that Company G has $100,000 in total liabilities and $200,000 in total assets. In this situation, its debt ratio can be calculated as follows:
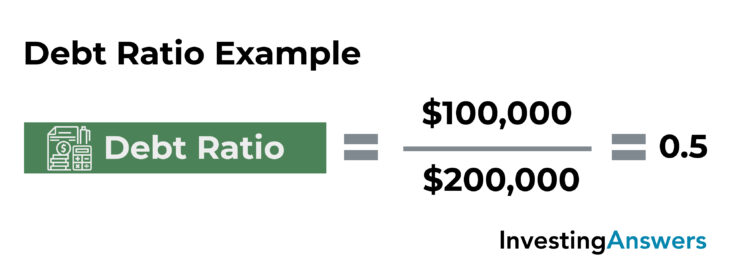
Based on this calculation, we can conclude that Company G has a debt ratio of 0.5, meaning its debt accounts for half of its assets.
What Is a Good Debt Ratio?
For the debt ratio, a lower number is generally better and indicates that the company has more assets than debts (i.e. is less leveraged). Since cash flows, capital structures, and financing methods vary between industries, it can be difficult to set a benchmark for what makes a “good” debt ratio.
8) Debt to Equity Ratio (D/E)
The debt-to-equity ratio is a measure of a company’s debt in relation to its equity. It indicates the degree to which its operations are funded by debt and whether shareholders’ equity can cover total liabilities.
How to Calculate D/E Ratio
D/E is calculated by dividing total liabilities by total shareholders’ equity. Similar to the debt ratio, a value greater than 1 indicates that the company has more debt (i.e. is more leveraged), whereas a value below 1 indicates less debt (i.e. is less leveraged).

D/E Ratio Example
Let’s assume that Company H has $100,000 in total liabilities and $50,000 in total shareholders’ equity. We can calculate the D/E ratio as follows:
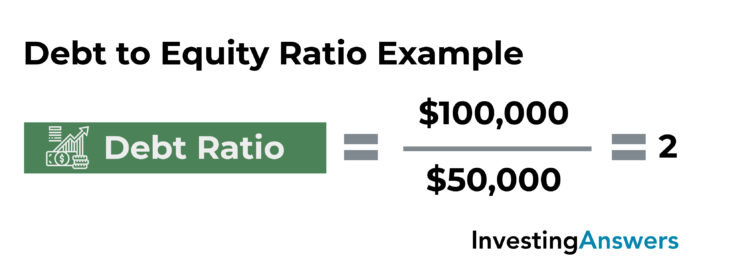
Company H has a debt to equity ratio of 2, meaning that it has twice as much debt as equity. This indicates that the company relies on debt to finance its operations – and that its shareholders' equity would not be able to cover all of its debts.
What Is a Good Debt-to-Equity Ratio?
Because capital structures, industries, and other variables can all influence the interpretation of the debt-to-equity ratio, a higher value isn’t always a bad sign. Debt can actually help companies increase their growth potential, so this important financial ratio should be used in conjunction with other metrics to gauge a company’s financial health.
9) Interest Coverage Ratio
The interest coverage ratio (also called “times interest earned”) determines the number of times a company can cover the interest payments on its debt using only its earnings before interest and taxes (EBIT).
More simply, interest coverage ratio measures a company’s ability to pay the interest on its debt. Since interest coverage helps ratio lenders and creditors gauge the level of risk involved in lending, it is a very important ratio for financial analysis.
How to Calculate Interest Coverage Ratio
The interest coverage ratio is calculated by dividing the company’s EBIT by its interest expense.

What Is a Good Interest Coverage Ratio?
A value above 1 indicates that a company's EBIT can cover its interest payments, whereas a value below 1 indicates that it cannot. A higher number is better because it reflects a greater ability to repay debt.
Example of Interest Coverage Ratio
Let's assume that Company I has $100,000 in earnings before interest and taxes (EBIT), and $20,000 in annual interest expenses. In this situation, its interest coverage ratio can be calculated as follows:

We can conclude that Company I has an interest coverage ratio of 5, meaning that its EBIT can cover its interest expense 5 times. This indicates that the company has a strong ability to cover its interest payments and wouldn't be considered a high risk for lenders or creditors.
10) Debt Service Coverage Ratio (DSCR)
The debt service coverage ratio measures a company’s ability to cover its outstanding debt obligations (e.g. interest, principal, lease payments) using its operating income. This key financial ratio shows whether a company has enough income to cover its debts and is often used to evaluate a company’s credit risk and debt capacity.
DSCR Formula
Debt service coverage ratio is calculated by dividing net operating income by total debt service (i.e. the sum of its debt obligations, including lease payments).

What Is a Good DSCR?
A value above 1 indicates that the company has enough cash flow to cover its debt obligations. A value below 1 indicates that it does not.
Debt Service Coverage Ratio Example
Let’s assume that Company J has $250,000 in net operating income and $300,000 in total debt service. In this situation, its debt service coverage ratio can be calculated as follows:
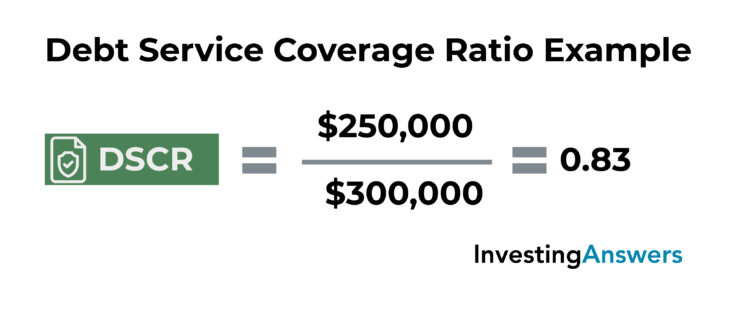
Based on this calculation, we conclude that Company J has a debt service coverage ratio of 0.83. This means that its operating income only covers 83% of its current debt obligations. It also indicates that the company may have trouble repaying its debts without raising external capital, and therefore could be considered high risk to lenders.
Note: Lenders sometimes require that companies maintain a certain DSCR in order to obtain a loan, though the requirement can vary on elements like the industry, project, and loan amount.
Market Ratios
Market ratios (also called price ratios and valuation ratios) are some of the most important financial ratios for investors and are used to evaluate the share price of a company. For instance, they can be used to determine whether share prices are overvalued, undervalued, or priced fairly. They are often used by investors to evaluate stocks as potential investments, analyze stock trends, and more.
However, it’s important to note that market ratios are relative metrics. This means that they are useful for comparing multiple companies, tracking a ratio over time, or comparing against a benchmark.
11) Price-to-Earnings (P/E) Ratio
The price-to-earnings ratio (or P/E ratio) is a common financial ratio that measures a company’s share price in relation to its earnings per share. In other words, it is the amount an investor must pay for each dollar of earnings. It indicates whether the market price of a stock reflects the company’s earnings potential or true value, and helps investors determine if it is under or overvalued.
P/E Ratio Formula
P/E ratio is calculated by dividing a company’s price per share by its earnings per share.

What Is a Good P/E Ratio?
Since this metric varies between industries, there is no benchmark for what makes a “good” P/E ratio. That said, a relatively high price-to-earnings ratio can indicate that the stock is overvalued or that it is expected to have significant future earnings growth. On the other hand, a low P/E ratio can indicate that either the stock is undervalued or expectations are low.
P/E Ratio Example
Let’s assume that Company K’s stock is currently trading for $50 and its most recent income statement showed that it generated $5 in earnings per share. In this situation, its price-to-earnings ratio can be calculated as follows:
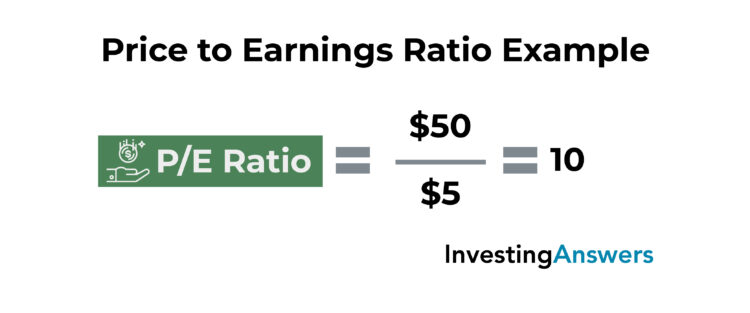
Based on this calculation, we can conclude that Company K has a price-to-earnings ratio of 10, meaning that investors pay $10 for every $1 of earnings generated by the company. If the industry average price-to-earnings ratio is 25, a P/E ratio of 10 could suggest that Company K’s stock is undervalued.
Let’s assume that Company L’s stock is also trading for $50, but its most recent income statement showed that it generated only $1 in earnings per share. In this situation, its price-to-earnings ratio can be calculated as follows:
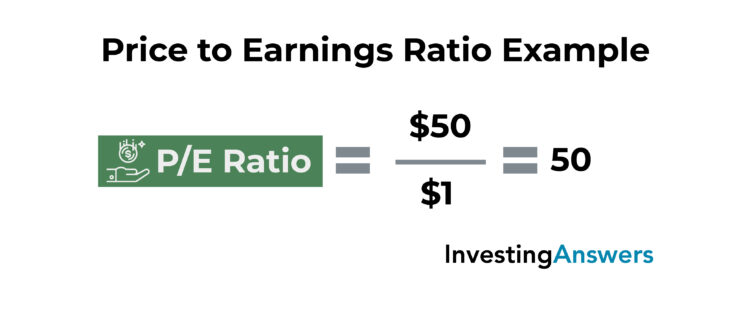
Based on this calculation, we can conclude that Company L has a price-to-earnings ratio of 50, meaning that investors pay $50 for every $1 of earnings generated by the company. If the industry average price-to-earnings ratio is 25, a P/E ratio of 50 could suggest that Company L’s stock is overvalued.
Since Company L has a higher P/E ratio, we can conclude that its shares are relatively more expensive than Company K’s because investors must pay more for each dollar of earnings.
12) Price/Earnings-to-Growth (PEG) Ratio
The PEG ratio adjusts the P/E ratio to account for expected growth of earnings. It is another useful financial ratio to determine the true value of a stock and whether it is undervalued or overvalued. The addition of the growth component also provides a more complete picture than the P/E ratio alone.
PEG Ratio Formula
The PEG ratio is calculated by dividing the P/E ratio by the expected growth of earnings per share.

What Is a Good PEG Ratio?
In general, a value below 1 may indicate that the stock is undervalued, whereas a value above 1 may indicate that it is overvalued.
Example of PEG Ratio
Building off the previous examples, let’s assume that Company K’s stock is currently trading for $50. Its most recent income statement showed that it generated $5 in earnings per share, which was 10% higher than its previous income statement (indicating EPS growth of 10%). In this situation, calculate the PEG ratio as follows?
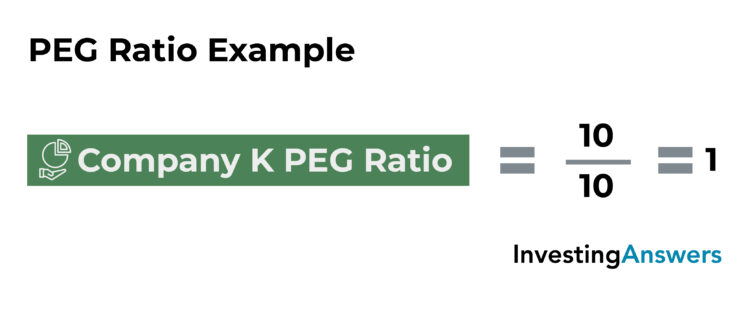
Based on this calculation, we can conclude that Company K has a PEG ratio of 1, meaning that its share price accurately reflects the true value of the company. Using the P/E ratio alone, the stock was considered undervalued, but by using the PEG ratio to account for EPS growth, the stock is priced fairly.
Now let’s assume that company L’s stock is still trading for $50. Its most recent income statement showed that it generated $1 in earnings per share – an increase of 100% from its previous EPS of $0.50. In this situation, its PEG ratio can be calculated as follows:
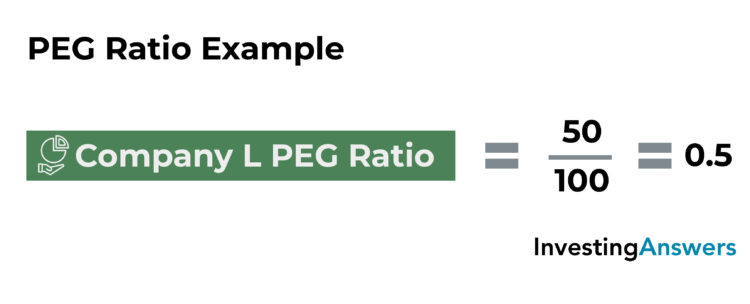
Based on this calculation, we can conclude that Company L has a PEG ratio of 0.5, meaning that its shares are trading at a discount to its growth rate. Using the P/E ratio alone, the stock was considered overvalued, but by using the PEG ratio to account for EPS growth, the stock is actually undervalued.
13) Price-to-Sales (P/S) Ratio
The price-to-sales ratio is an important stock ratio that measures a company’s share price in relation to its sales per share. This is the price investors must pay for each dollar of sales.
Price-to-Sales vs. Price-to-Earnings
The P/S is similar to the price-to-earnings ratio, but it uses revenue rather than earnings. This makes it one of the best ratios to evaluate companies that haven’t generated profit within the previous 12 months. Like the P/E ratio, it is a relative metric, meaning it can be used to compare against other companies or industries.
Calculating P/S Ratio
Price-to-sales ratio can be calculated by dividing a company’s market capitalization by its total revenue within a given period. It can also be calculated by dividing its current share price by its sales per share. A lower value may indicate that the stock is undervalued, whereas a higher value may indicate that the stock is overvalued.

P/S Ratio Example
Let’s assume that Company M’s stock is currently trading for $100 and its most recent income statement showed that it generated $2,000,000 in sales over the past 12 months. It has 100,000 shares outstanding, so its sales per share is equal to $20 ($2,000,000 in sales divided by 100,000 shares).
In this situation, its P/S ratio can be calculated as follows:
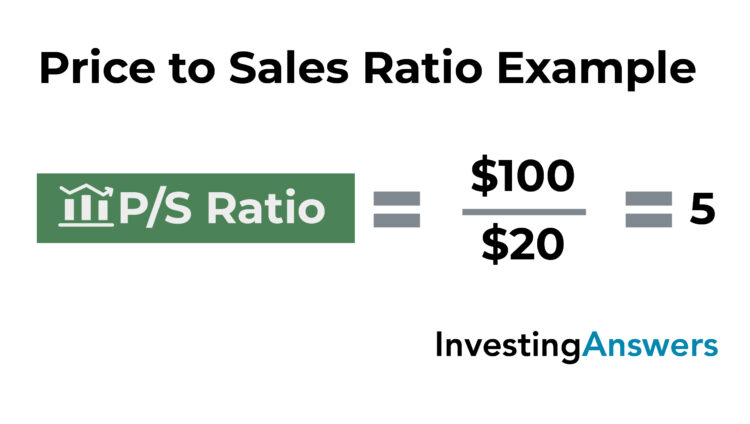
Based on this calculation, we can conclude that Company M has a P/S ratio of 5, meaning that investors pay $5 for every $1 of sales generated by the company. If the industry average price-to-sales ratio is 10, a P/S ratio of 5 could suggest that Company M’s stock is undervalued. However, if the industry average is 2, a P/S ratio of 5 could suggest that Company M’s stock is overvalued.
What Is a Good P/S Ratio?
Generally speaking, a lower P/S ratio means that investors have to pay less for each dollar of sales. However, averages vary between industries – and the P/S ratio – doesn’t show the whole picture. Therefore, it’s important to combine it with other metrics.
14) Price-to-Book (P/B) Ratio
The price-to-book ratio is a measure of a company’s share price in relation to its book value of shareholders’ equity, indicating the price investors must pay for each dollar of book value. Like the price-to-earnings ratio and price-to-sales ratio, this relative metric is better suited for comparisons against other companies and industries.
P/B Ratio Formula
Price-to-book ratio is calculated by dividing the company’s current share price by its book value per share.

What Is a Good P/B Ratio?
A lower value can indicate that the stock is underpriced, whereas a higher value may indicate that the stock is overpriced.
Price-to-book ratios vary between industries, making it difficult to set a benchmark for what makes a “good” price-to-book ratio. However, if the value falls below the industry average, it may indicate that the stock is undervalued. If the value is above the industry average, it may indicate that the stock is overvalued.
Example of P/B Ratio
Let’s assume that Company N’s stock is currently trading for $30 and its most recent balance sheet showed $1,000,000 in shareholders’ equity (the same as book value). It has 100,000 shares outstanding, so its book value per share is equal to $10 ($1,000,000 in sales divided by 100,000 shares).
In this situation, its P/B ratio can be calculated as follows:
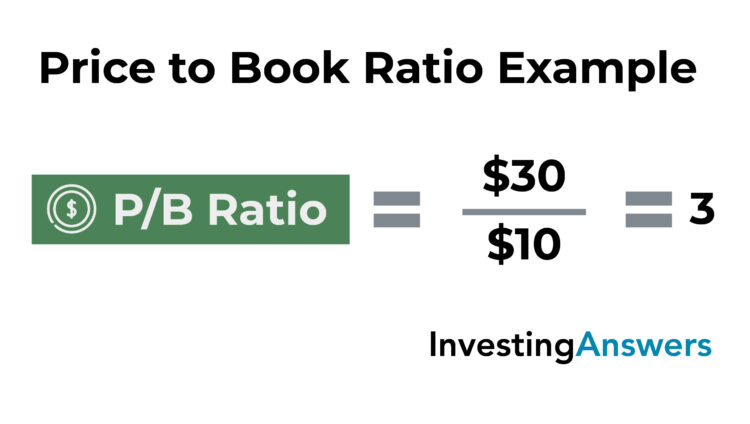
Based on this calculation, we can conclude that Company N has a price-to-book ratio of 3, meaning that investors pay $3 for every $1 of book value.
15) Dividend Yield
Dividend yield is an important financial ratio that measures of a company’s annual dividend payouts relative to its stock price. Expressed as a percentage, it indicates the value of dividend payouts shareholders receive for each dollar of the company’s stock that they own. For investors who prioritize dividend payouts over capital gains, dividend yield is a way of measuring return on investment.
Dividend Yield Formula
Dividend yield is calculated by dividing dividend per share by price per share, then multiplying by 100.

What Is a Good Dividend Yield?
A higher number indicates a larger value of dividend payouts relative to share price, whereas a lower number indicates a smaller value of dividend payouts relative to share price.
While averages can vary between companies and industries, a dividend yield between 3% to 5% is generally considered good.
Dividend Yield Example
Let’s assume that Company O’s stock is currently trading for $20. Its most recent income statement showed that it paid $1,000,000 in dividends.
Company O has 1,000,000 shares outstanding, so its dividends per share is equal to $1 ($1,000,000 in dividends paid divided by 1,000,000 outstanding shares). In this situation, its dividend yield can be calculated as follows:
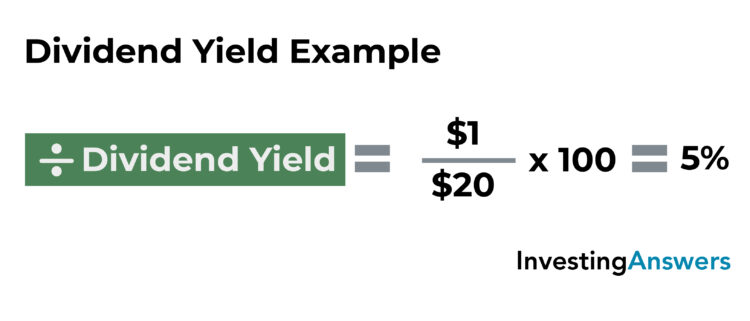
Based on this calculation, we can conclude that Company O has a dividend yield of 5%, meaning that investors receive $0.05 for every dollar of shares they own.
16) Dividend Payout Ratio
The dividend payout ratio measures the total amount of dividends a company pays to its shareholders relative to its net income. Expressed as a percentage, it indicates the proportion of earnings that get distributed as dividends, making it an important financial ratio for investors. The remaining amount is held as retained earnings and can be used for debt, operations, cash reserves, or investments.
How to Calculate Dividend Payout Ratio
To calculate the dividend payout ratio, divide dividends paid by net income and multiply by 100.

What Is a Good Dividend Payout Ratio?
40% is considered a “good” dividend payout ratio, but averages vary depending on the company, industry, and a multitude of other factors. Generally speaking, a higher value indicates that more of the company’s earnings are paid as dividends, whereas a lower ratio indicates that more of its earnings are reinvested back into the company.
Dividend Payout Ratio Example
Let’s assume that Company P’s income statement showed that it distributed $500,000 in dividends and generated $1,200,000 in net income. In this situation, its dividend payout ratio can be calculated as follows:

Based on this calculation, we can conclude that Company P has a dividend payout ratio of 41.6%, meaning that 41.6% of its net income is distributed as dividends and 58.4% (100%-41.6%) of its net income is held as retained earnings.
Activity Ratios
Activity ratios (also called operating ratios and efficiency ratios) measure how a company uses its resources to generate sales. These important financial ratios are often used by investors to gauge the efficiency of an operation, the speed at which cash is collected, the rate at which inventory is turned over, and so on.
These fundamental analysis ratios are most effective when used as comparisons over time, either to measure an improvement in company performance or see how it stacks up to its industry peers.
17) Asset Turnover Ratio
The asset turnover ratio measures how efficiently a company generates sales from its assets. In other words, it is the value of sales that it earns for each dollar of owned assets.
Asset Turnover Ratio Formula
Asset turnover is calculated by dividing net sales by average total assets.

What Is a Good Asset Turnover Ratio?
A higher value indicates greater efficiency in generating sales from assets, whereas a lower value indicates less efficiency. While averages can vary between industries, a number above one indicates that the company is efficient at using assets to generate sales (while a number below one indicates that it is not).
Asset Turnover Ratio Example
Let’s assume that Company Q’s income statement showed that it generated $800,000 in sales. Its balance sheet showed that it had $500,000 in assets at the beginning of the period and $300,000 in assets at the end of the period. This works out to $400,000 in average total assets ([$500,000 + $300,000] / 2).
In this situation, you can calculate asset turnover ratio as follows:

Based on this calculation, we can conclude that Company Q has an asset turnover ratio of 2, meaning that it generates $2 in sales for every $1 in assets it owns.
18) Inventory Turnover Ratio
The inventory turnover ratio measures the number of times a company sells (or otherwise replaces) its inventory within a given period. It is used to determine how effectively a company’s inventory is managed and how quickly its products are sold.
Inventory Turnover Ratio Formula
To calculate the inventory turnover ratio, divide the cost of goods sold (COGS) by average inventory.

What Is a Good Inventory Turnover Ratio?
A higher value can indicate that products are being sold quickly or that inventory levels are insufficient. A lower value can indicate that products are being sold slowly, inventory is becoming obsolete, or inventory levels are in excess.
Averages for the industry turnover ratio can vary depending on a number of factors, so it is best used as a comparison tool against previous time periods, other companies, or other industries.
Example of Inventory Turnover Ratio
Let’s assume that Company R’s income statement showed $100,000 in cost of goods sold. Its balance sheet showed $60,000 in inventory at the beginning of the year and $30,000 in inventory at the end of the year, which works out to $45,000 in average inventory ([$60,000 + $30,000] / 2).
In this situation, its inventory turnover ratio can be calculated as follows:

Based on this calculation, we can conclude that Company R has an inventory turnover ratio of 2.22, meaning that it cycled through its inventory 2.22 times in one year.
19) Receivables Turnover Ratio
The receivables turnover ratio measures how many times a company collects its accounts receivable in a given period. This key financial ratio highlights the company’s efficiency in issuing credit and collecting money owed by its clients.
How to Calculate Receivable Turnover Ratio
Receivable turnover ratio is calculated by dividing net credit sales by average accounts receivable.

What Is a Good Receivable Turnover Ratio?
A higher receivable turnover ratio may indicate that the company is efficient at collecting money owed or that it has a conservative credit policy (e.g. issues less credit, has short payment terms). A lower value can indicate that the company is inefficient at collecting money owed or that it issues credit too generously to customers that are unable to make payments.
Averages for the receivables turnover ratio can vary between industries and companies, making it difficult to set a benchmark for what makes a “good” receivables turnover ratio. That said, it is useful for making comparisons against previous years, other companies, or other industries.
Receivables Turnover Ratio Example
Let’s assume that Company S’s income statement showed that it had $2,000,000 in net credit sales (credit sales - sales returns - sales allowances). Its balance sheet showed that it had $200,000 in accounts receivable at the beginning of the year and $50,000 in accounts receivable at the end of the year, which works out to $125,000 in average accounts receivable ([$200,000 + $50,000] / 2).
In this situation, its receivables turnover ratio can be calculated as follows:

Based on this calculation, we can conclude that Company S has a receivables turnover ratio of 16, meaning that it collected its accounts receivables 16 times in one year.
Bonus: Calculating Receivables Turnover in Days
Using the value obtained from the receivables turnover ratio, investors, analysts, and companies can determine the average number of days it takes a company to collect its accounts receivable. To do this, simply divide 365 by the company’s receivables turnover ratio. Using the example above:

Based on this calculation, we can conclude that it takes Company S 22.8 days to collect its accounts receivable.
20) Payables Turnover Ratio
Also called the accounts payable turnover ratio, the payables turnover ratio measures the number of times a company pays its accounts payable in a given period. This useful financial ratio gauges a company's efficiency in paying its creditors and is often a factor in determining creditworthiness.
Payables Turnover Ratio Formula
You can calculate payables turnover ratio by dividing net credit purchases by average accounts payable.

What Is a Good Payables Turnover Ratio?
A higher value indicates that the company is more efficient at managing its cash flows and paying its creditors, while a lower value indicates that it is less efficient. Averages for the payables turnover ratio can vary, so it is difficult to set a benchmark for what makes a “good” receivables turnover ratio.
Example of Payables Turnover Ratio
Let’s assume that Company T’s income statement showed that it had $500,000 in net credit sales (cost of goods sold + ending inventory - starting inventory).
Its balance sheet showed that it had $150,000 in accounts payable at the beginning of the year and $50,000 in accounts payable at the end of the year, which works out to $100,000 in average accounts payable ([$150,000 + $50,000] / 2).
In this situation, its payables turnover ratio can be calculated as follows:

Based on this calculation, we can conclude that Company T has a payables turnover ratio of 5, meaning that it paid its accounts payable 5 times in one year.
Bonus: How to Calculate Payables Turnover in Days
Based on the information obtained from the payables turnover ratio, it is possible to determine the average number of days it takes a company to pay its accounts payable. This is done by dividing 365 by the company’s payables turnover ratio. Using the example above:

Based on this calculation, we can conclude that it takes Company T 73 days to pay its accounts payable.
These Key Financial Ratios Are Just the Beginning
While these are the most important financial ratios to analyze a company, they’re just the tip of the iceberg. There are a number of other research and analysis methods that can provide even more insight, such as:
For added confidence, a combination of ratios and tools can provide a more complete picture of potential investments.


