What Is Return on Equity (ROE)?
Return on equity (ROE) is a measurement of how effectively a business uses equity – or the money contributed by its stockholders and cumulative retained profits – to produce income. In other words, ROE indicates a company’s ability to turn equity capital into net profit.
You may also hear ROE referred to as “return on net assets.”
Return on Equity Interpretation
A high ROE suggests that a company’s management team is more efficient when it comes to utilizing investment financing to grow their business (and is more likely to provide better returns to investors). A low ROE, however, indicates that a company may be mismanaged and could be reinvesting earnings into unproductive assets.
ROE: Is Higher or Lower Better?
ROE measures profit as well as efficiency. A rising ROE suggests that a company is increasing its profit generation without needing as much capital. It also indicates how well a company's management deploys shareholder capital.
A higher ROE is usually better while a falling ROE may indicate a less efficient usage of equity capital.
Use Caution with High Return on Equity Interpretation
A high ROE might indicate a good utilization of equity capital, but it may also mean the company has taken on a lot of debt. That’s why it’s important to avoid looking at this financial ratio in isolation. Excessive debt and minimal equity capital (also known as a high debt-to-equity ratio) may make ROE look artificially higher than competitors with lower debt.
How to Interpret ROE Within Different Industries
Interpretation is highly dependent on the average ROE in a company’s industry. Some industries tend to have higher returns on equity than others (or require less equity capital to operate). As a result, comparisons are generally most meaningful among companies within the same industry, and the definition of a 'high' or 'low' ROE ratio should be made within this context.
For example, in 2020, a standard ROE for companies operating in the auto industry was around 12.5%. An ROE for a company in the retail sector, however, was well over 18%.
ROE Interpretation Example
Let’s say Auto Company XYZ held a sustained ROE of 14% over the last three years, while similar companies within its industry averaged 12.5%. With this data, we might assume that Auto Company XYZ’s management team is better than average at utilizing company equity to generate profits (assuming the use of debt is the same across the auto industry).
Now, let’s say that Retail Company UVW has sustained an ROE of 16% over the last three years (while similar companies within its industry averaged 18%). Even though Retail Company UVW has held a higher ROE than Auto Company XYZ, it may be comparatively less efficient at generating profits because it's underperforming (compared to similar companies, assuming the use of debt is the same across the retail industry).
How to Calculate Return on Equity
You can calculate ROE by dividing the company’s net income by the average shareholder equity. The ROE equation is often used to determine capital efficiency over a fiscal year, however, it could also be applied to different periods of time.
To calculate the ROE for the most recent 12 months, divide the 12 months’ net income by the average total equity over that same 12-month period. Analyzing changes in a company’s yearly or quarterly ROE can be extremely helpful in monitoring equity efficiency fluctuations.
Return on Equity Formula
You can calculate ROE with a simple equation:
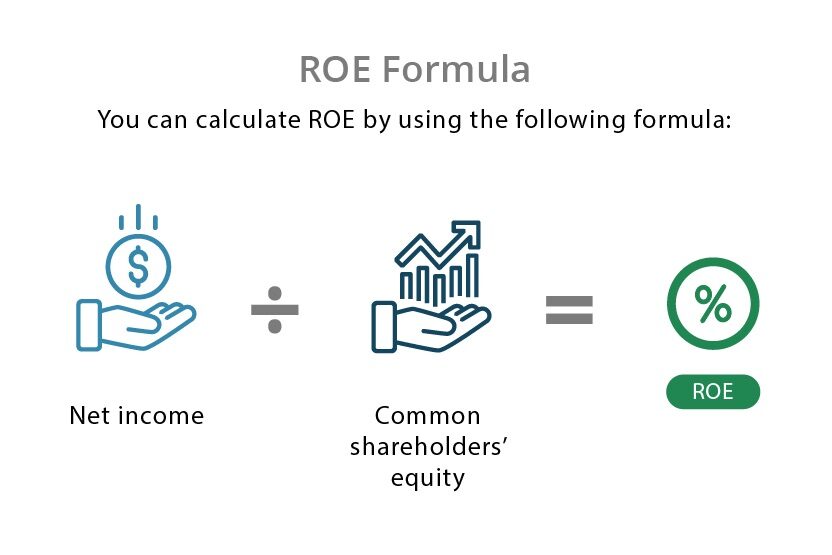
Note: The above equation looks at equity efficiency for all shareholders (including non-controlling interests).
What Is Net Income?
Net income refers to the total profit that a company makes within a set period of time, prior to any distributions of dividends. Net income can be found on the company’s income statement, one of three primary financial reports summarizing its performance and position.
What Is Shareholders' Equity?
Shareholders’ equity is found on a company balance sheet, a financial statement reporting assets, liabilities, and equity at the end of a fiscal year. It measures how much of a company's net assets belong to the shareholders.
Return on Equity Example
Say Company ABC generated $10 million in net income last year. If Company ABC’s average total equity equaled $20 million last year, we can calculate Company ABC’s ROE as:
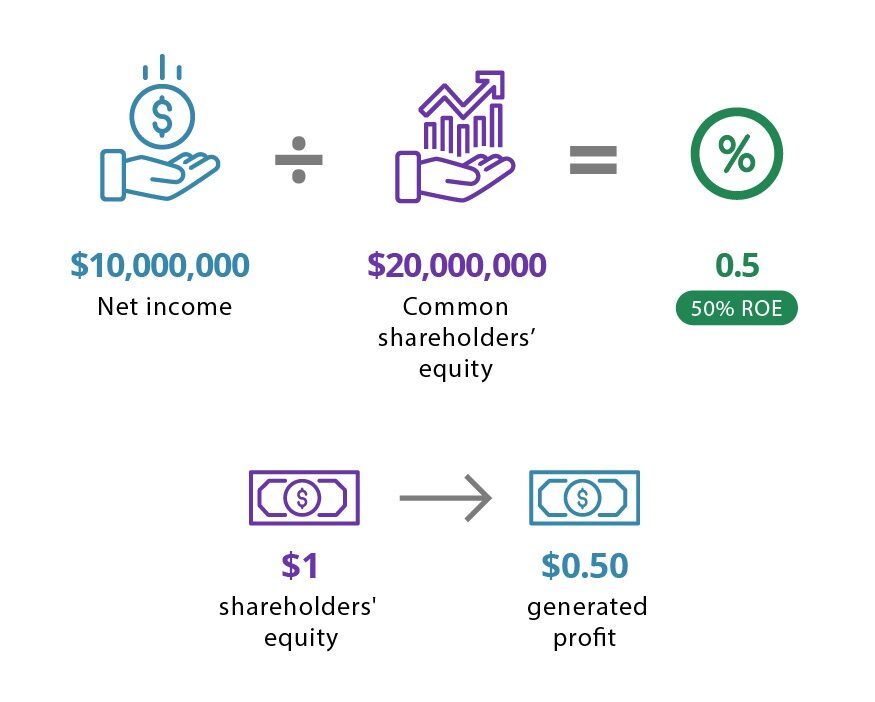
This means that Company ABC generated $0.50 of profit for every $1 of total equity last year, giving the company an ROE of 50%.
Return on Equity vs. Sustainable Growth Rate
A company’s return on equity can be used to predict its growth rate (also known as the sustainable growth rate).
SGR is the realistic pace at which a business can grow with internally-generated net income or profit – without having to finance its growth with borrowed money or by seeking more equity from shareholders.
Investors can use a company’s SGR to predict the financial health of a company and determine the riskiness of the company, hence the ability of the stock to maintain and grow its value.
A higher SGR suggests that a company is retaining and reinvesting profits to generate business growth. A high SGR generally indicates that management believes there are sufficient investment opportunities to generate a solid return to shareholders. A low SGR is often seen in more mature businesses where investment opportunities yield a lower return on equity.
Sustainable Growth Rate Formula
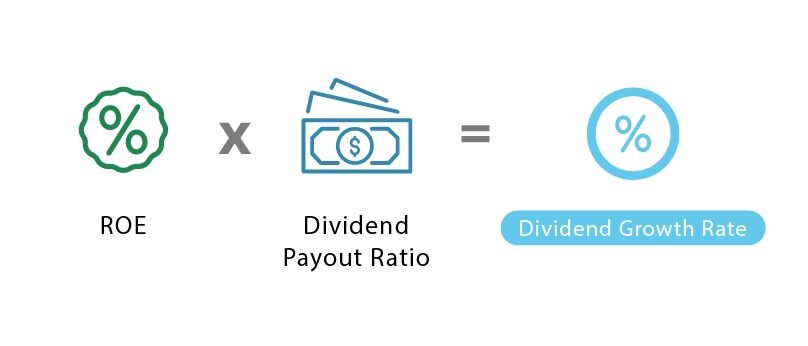
SGR is calculated by subtracting the company’s dividend payout ratio (ie. the portion of net income distributed to stockholders in the form of dividends) from 1. Next, multiply that number by the company’s ROE.
Sustainable Growth Rate Example
Say that Company DEF and Company GHI have the same ROE but offer a different dividend payout ratio. Company DEF has an ROE of 18% and pays 20% in dividends to stockholders (thus retaining 80% of its income).
Company GHI also has an ROE of 18% but pays 10% in dividends to stockholders (retaining 90% of its income).
We can estimate the sustainable growth ratio of Companies DEF and GHI through the following formula:
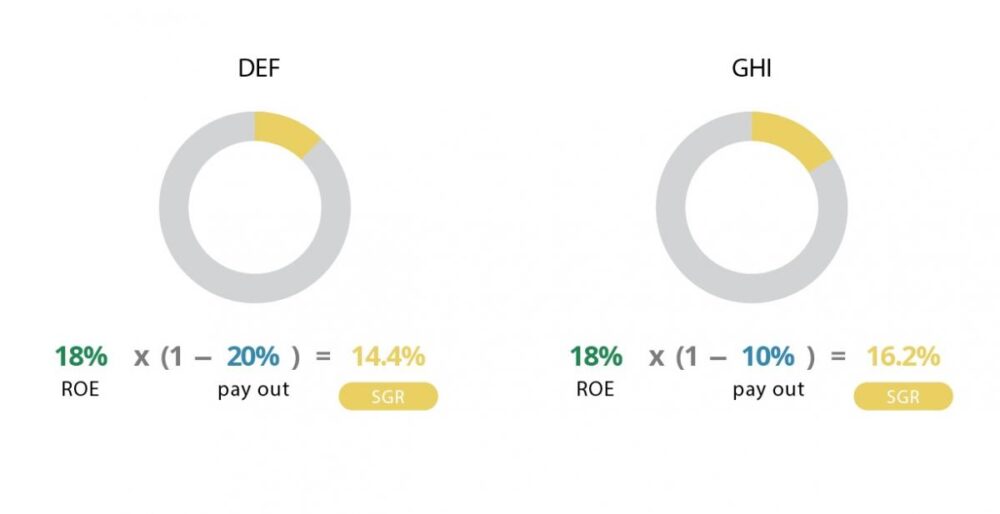
These numbers suggest that Company GHI reinvested more of its profits back into their business than Company DEF, and is, therefore, more appealing to investors. However, some investors may prefer a high dividend payout rate to a high sustainable growth rate (because dividend-paying stocks provide consistent income).
High ROE: Advantages & Disadvantages
While a high ROE may indicate that a company is efficient at using equity to generate income and grow their business, it’s not always a good thing.
If a company’s ROE is significantly higher than the average ROE of similar companies in their industry, it could be a warning sign of:
1. Share Buybacks or High Dividend Payout Ratios
In some cases, a company may reduce its equity by repurchasing its own shares and/or using excessive amounts of debt to operate the business. When equity is reduced, ROE rises – even if the company is mismanaged.
2. Higher Debt
Rising debt levels can result in a higher ROE. Debts are subtracted from assets in order to calculate equity, thus reducing the divisor and resulting in a higher ROE. On the other hand, paying down debt can make an ROE appear lower, even though in the long run, the company is more financially sound because it does not have a higher debt burden.
3. Erratic Earnings
In some instances, a high ROE may indicate inconsistent earnings. For example, if a company has been unprofitable for a number of years, the cumulative losses can reduce stockholder equity. When this happens, the smaller divisor results in a higher ROE.
Return on Equity vs. Return on Assets
Like return on equity, return on assets (ROA) is another financial metric that can help indicate the asset use efficiency of a business. However, ROA measures the net income a company produces in relation to its total assets – not its equity.
For investors, analysts, and managers, ROE and ROA are only two of the many important metrics used to determine how a company is performing (relative to similar companies within its industry).


