It seems like a simple question: What is the P/E ratio of the S&P 500?
Unfortunately, the answer is not as straightforward as most investors would like it to be. In fact, if you look at the Standard and Poor's website you'll see there are five different answers to the question because there are five different earnings categories you can use as the E in your P/E ratio.
Actual Numbers
The first two earnings measures are actual numbers that have been reported by companies.
As Reported Earnings: As reported earnings are the earnings a company reports pursuant to Generally Accepted Accounting Principles (GAAP); as reported earnings are equivalent to the net income reported on income statements filed with the SEC. To learn about the basics of the income statement, click here.
Operating Earnings: Operating earnings attempt to filter out some of the unusual items and adjustments that GAAP allows management to report on the income statement. Operating income reflects income generated by normal business operations because it doesn't include one-time losses, taxes, interest expenses or paper profits/losses on tradable securities. Operating earnings are generally higher than as reported earnings, unless the company reports a large one-time gain.
S&P also provides forecasts of future earnings. It has hundreds of analysts who cover specific companies and issue reports estimating how they think they'll perform. 'Bottom up' earnings estimates for the S&P 500 are simply the sum of analysts' earnings estimates for all the component companies.
S&P also has economists and analysts that issue reports on the macroeconomic outlook. 'Top down' earnings estimates for the S&P 500 approximate how much earnings will grow or decline over the coming year based on macro factors. For example, since U.S GDP is expected to grow at +X%, then corporate earnings should grow at +Y%.
Earnings Forecasts
There are three S&P earnings forecasts, two top down and one bottom up.
Forward As Reported Earnings (Top Down): Forward as reported earnings for the S&P are based on a projected growth rate derived from macro models.
Forward Operating Earnings (Top Down): Forward operating earnings for the S&P 500 are also based on a projected growth rate derived from macro models.
Forward Operating Earnings (Bottom Up): Forward operating earnings for the S&P 500 can also be projected using a bottom up method. These earnings forecasts are derived by adding up analyst earnings estimates for each company in the S&P 500.
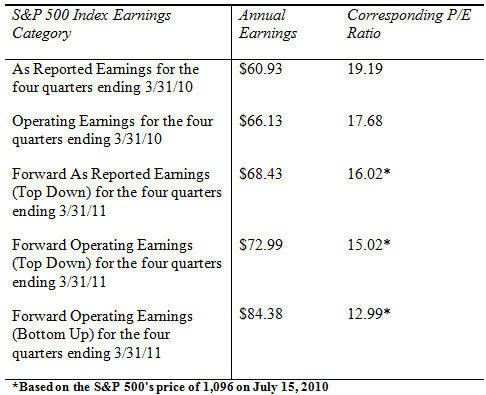
So what are the numbers for the five earnings categories? And the corresponding P/E ratios?

Which Is the Right Number?
There is an ongoing debate as to the best way to calculate the P/E ratio. The best answer may be that it's important to calculate and understand all the variations because they each include useful information.
Personally, I prefer the backward-looking as reported P/E ratio because it reflects something that actually happened. But the downside to that measure is it doesn't address what might happen in the future.
The problem with using forward-looking P/E ratios is that you are dependent on forecasts. The forecast of future earnings can be all over the place, depending on the assumptions and methods used by the analyst. note that according to S&P, operating earnings estimates for the 12 months ending 3/31/10 are anywhere from $84.38 to $72.99, almost a 16% variance!
Analysts tend to use the P/E ratio that supports their point of view -- another great reason to be familiar with all the different calculations. If an analyst believes the market is undervalued, he'll use numbers that reflect that opinion. He may reference the P/E ratio based on forward operating earnings using the bottom up methodology, which gives him a P/E ratio of 12.99 and supports his view that the S&P 500 is undervalued. An analyst pushing the view that the same index is overvalued would reference the actual P/E ratios from the end of March to support her view.
I prefer to use conservative numbers to lower my risk. That doesn't mean I won't consider forward P/E ratios. It means I want to be sure I understand the context of the forecast and recognize any built-in biases before relying on them.
For example, over time S&P 500 earnings tend to grow at approximately the same rate as U.S. GDP. Today, the U.S. economy is struggling and many economists are predicting a 2.5 - 3.5% growth rate during the next several years.
If this is a realistic assumption, we should expect the earnings growth rate of the S&P 500 to migrate toward the GDP growth rate. Since earnings have recently grown much faster than GDP (which is unsustainable), we can reasonably expect the growth of earnings to slow in the future. If forecasts predict a much higher or much lower growth rate, I want to know why.
What is the P/E Ratio Telling Us Now?
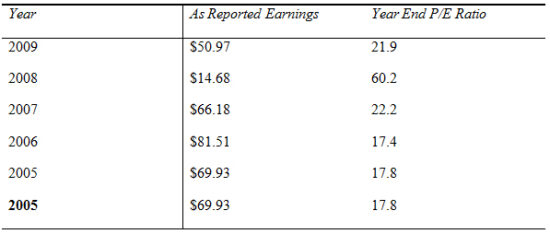
Since 1936, the S&P 500 P/E ratio for trailing as reported earnings has ranged from 5.9 in June 1949 to 60.2 in December 2008. The average P/E ratio over this period was 15.98.
Using the as reported actual earnings as a measurable category, the following table gives you a comparison for prior years.

If you assume 15.98 is the S&P 500's neutral P/E ratio for as reported earnings, any P/E ratio above this level could be consider overvalued and any below this level could be considered undervalued. Keep in mind this is for as-reported earnings, not operating earnings.
My first observation is the P/E ratio for the recent years indicates the index was overvalued. Second, the current as reported earnings P/E ratio of 19.19 for the past four quarters indicates it's still overvalued.
If you accept S&P's earnings forecasts, the forward as reported P/E ratio of 16.02 indicates the market would be at fair value in one year if the price of the S&P 500 stays at its current level. It also assumes that the earnings forecast is accurate and does not overestimate or underestimate future earnings.
Forecasting anything is tricky business. But having the ability to critically analyze forecasts is a valuable tool for any investor. To learn more about using the P/E ratio to find value, check out some of this other must-read article from InvestingAnswers: Don't Be Misled By the P/E Ratio.


