Moving averages define the trend and provide support or resistance. They also give trading signals when they move through each other. These signals are called 'moving average crossovers.'
A crossover signal is generated when a shorter moving average crosses over a long term one and visa versa.
When the shorter-term moving average crosses above the longer-term moving average, it creates a buy signal.
When the shorter-term moving averages crosses below the longer-term, a sell signal is given.
Different combinations of moving averages can be used to guide trading decisions. The 40-week moving average combined with the 10-week moving average is particularly valuable for indicating the long-term movement of a stock. Observing when the cross occurs in real time can, therefore, provide a very valuable buy or sell signal.
The fall of the 10-week moving average below the 40-week moving average creates a pattern known as the 'death cross.' As the name implies, this is a highly bearish sign signifying that the current downtrend is likely to remain in force for a long period of time.
In contrast, the rise of the 10-week moving average above the 40-week moving average creates a pattern known as a 'golden cross.' This is a highly bullish sign indicating the uptrend is likely to continue.
To make accurate trading decisions, these moving average crossovers are most effective when combined with other technical analysis tools such as candlesticks or indicators such as MACD.
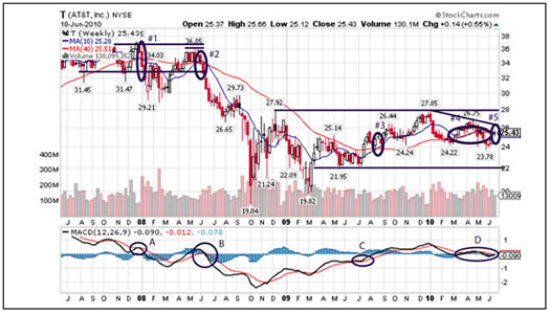
The three-year weekly chart of AT&T provides a good example of both the bearish death cross and bullish golden cross.

The first death cross (labeled #1) occurred in early January 2008 when the downward sloping 10-week moving average crossed below the upward sloping 40-week moving average. At the occurrence of the death cross, the stock crossed, then dropped below the 10-and 40-week moving averages. From a high near $37, T fell to a low near $29 in less than month. Traders who spotted the death cross and acted on its signal could have made a quick +22% profit.
note the movement of MACD (labeled A). Prior to the death cross, the indicator was on the verge of giving a buy signal. But in conjunction with the death cross, MACD, dipped back down, reaffirming the sell signal. The MACD histogram also began building in negative territory.
Finding support in the low $30s, AT&T managed to regain some ground by May 2008. At this point, the stock climbed above the 10- and 40-week moving averages, hitting a high near $36. The 10-week moving average very briefly went back above the 40-week.
However, encountering historical resistance around $36, the stock faltered. Once again, a death cross occurred (labeled #2) as the 10-week moving average went below the 40-week. Within five months, the stock dropped to a low near $19. Traders who shorted the stock upon the appearance of the death cross would have made hefty +47% returns. The sell signal given by MACD (labeled B) provided additional evidence of the stock's bearish movement.
For more than a year, from June 2008 - July 2009, T hovered around the falling 10-week moving average. Significant resistance -- which the stock could not break -- was marked by the downward-sloping 40-week moving average.
In late July 2009, T managed to climb above the 10- and 40-week moving averages. MACD signaled a buying opportunity at this time (labeled C). A bullish golden cross appeared shortly after (labeled 3). Following the golden cross, AT&T rose to a height of $27.85, where it encountered significant resistance. However, traders who had bought at the occurrence of the golden cross and held until the January 2010 high could have made +16% profits.
Since March 2010, the 10- and 40- week moving averages have essentially converged, as the stock has wavered above and below these support and resistance points (labeled 4). MACD has been equally noncommittal, crossing between a weak buy and sell signal (labeled D).
However, a bearish death cross (labeled 5) has again occurred. If confirmed by MACD and other technical indicators, traders can again profit from shorting the stock.
By using death and golden crosses to help make trading decisions, you can cross some uncertainty off your list of trading worries.


