In the June 21 edition of 'Principles of Technical Analysis', I described how to improve your trading from reading Japanese candlesticks.
This week's section describes a specific Japanese candle, the doji.
In my opinion, the doji is the most important candlestick to recognize of all the candlestick patterns. Failure to recognize the doji means running the risk of buying at the top, not recognizing an important bottom or staying in a trade too long.
A doji represents equilibrium between supply and demand; it marks a tug of war between the bulls and bears. It also can indicate the beginning of a minor or intermediate trend reversal. It is equally as significant on the daily as on the weekly chart.
There are four types of dojis: common, long-legged, dragon-fly and gravestone. All dojis are marked by some sort of cross-like or plus sign shape and lack of real body. This shape signifies that price opened and closed at approximately the same level.

Common Doji
A common doji looks like a plus sign. It takes this shape because the stock trades in a small range, opening and closing at nearly the same level. The common doji reflects indecision about a stock's direction.

Long-Legged Doji
A long-legged doji is a far more dramatic candle. It has a long lower-shadow. This doji candle shows that prices moved up before profit taking occurred. A close below the mid-point of the candle shows weakness in the stock. When the long-legged doji occurs outside the upper Bollinger Band ®, after a sustained uptrend, it marks the possibility of a trend reversal. A subsequent sell signal through an indicator like stochastics is typically a very reliable sign a correction will occur.

Gravestone Doji
A gravestone doji is an ominous candle that shows prices rallied, but could not sustain their high. At the end of the trading period, the stock comes back and closes at the same level it opened. These candles usually resolve bearishly.

Dragonfly Doji
A dragonfly doji depicts that prices opened high, sold off, then returned to their opening price. Dragonfly dojis are fairly infrequent. But, when they occur, they often resolve bullishly, provided the stock is not already overbought.
When assessing a doji, always notice where the candlestick occurs. If it is in the early stages of an uptrend or downtrend, it is unlikely the doji will mark a top. However, if it is in the mature stages of an uptrend or downtrend, the probability of a trend reversal is increased.
On the other hand, if the doji occurs in the middle of a Bollinger Band (rather than outside the upper or lower band), it likely signifies a pause in the stock's movement.
As significant as the doji candle may be, always wait for the next candlestick to take trading action. Confirm your analysis with indicators such as MACD or stochastics. Short-term moving averages such as the combination of the four- and nine-day can also improve your accuracy.
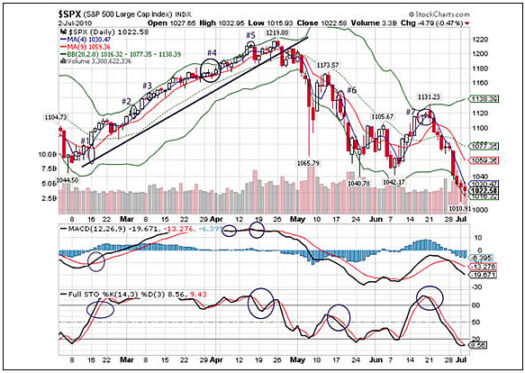
The five-month daily chart of the S&P 500, from February of this year to the present, provides good examples of the various doji candles.

In mid-February, the index closed on a dragonfly-like doji (labeled #1). This infrequently occurring candle signified the S&P's bullishness as prices declined during the day but were able to recover by the close.
The intermediate-term uptrend started near this candle. At this point, the short-term four-day moving average bullishly crossed over the nine-day moving average. Also note how the MACD indicator had just recently given a buy signal. And, at this point, stochastics was not yet deeply overbought. Note how the next several day's candles are bullish.
In early March, a gravestone-like doji appeared (labeled #2), showing a price that rallied but which could not sustain the altitude. By the end of the day, the price closed near the same level it opened. Note the next day's candles. The S&P consolidated for a few days in this range before rallying.
Around March 9, a common doji occurred (labeled #3). Although close, this candle was not outside the upper Bollinger Band. Therefore, it did not mark a significant trend reversal. The S&P continued to move up.
In late March-early April, three common doji candles occurred in four days. These candles (labeled #4) marked indecision about the S&P's next move. At this point, MACD also showed indecision, wavering between a buy and sell signal. Note how the four- and nine-day moving averages converged at this time, showing the saw-off between the bears and the bulls.
The tension was resolved by the S&P moving higher, but soon after a common doji appeared outside the upper Bollinger Band (labeled #5). After a long uptrend, this doji provided early warning that the uptrend had close to peaked. At this point, MACD also gave a weak sell signal. And stochastics, which was deeply overbought, began to decline from overbought levels before giving a significant sell signal a few days later. Note the next day's candle is a large bearish engulfing candle.
By May, the S&P had peaked. Around May 17, a long-legged doji appeared. The shadow probed the lower Bollinger Band. It also appeared simultaneously with the bearish cross-over of the four- and nine-day moving averages. Not surprisingly, this candle resolved bearishly.
By mid-June, it appeared the S&P was back on an upswing. However, the occurrence of three dojis in a row (labeled #7) showed significant indecision about the index's next movement. The sell signal given by stochastics warned of an impending correction that we are still in and which has taken the index below key 1040 support.
Traders who noted the various dojis were well-positioned to take appropriate long or short position in the market.
By identifying the candle that looks like a 'plus sign' you can add to your trading profits!


