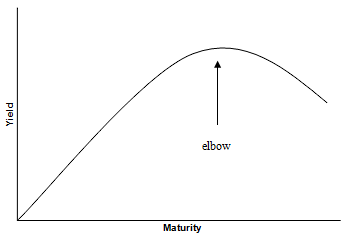
What is a Yield Elbow?
A yield elbow is the highest point on the yield curve.
How Does a Yield Elbow Work?
Also known as the term structure of interest rates, the yield curve is a graph that plots the yields of similar-quality bonds against their maturities, ranging from shortest to longest. Note that the chart does not plot coupon rates against a range of maturities -- that's called a spot curve.
The yield curve shows whether short-term bond yields are higher or lower than long-term bond yields. There are three main types of yield curves. If short-term yields are lower than long-term yields, the curve is called a positive (or 'normal') yield curve. If short-term yields are higher than long-term yields, the curve is called a negative (or 'inverted') yield curve. A flat yield curve exists when there is little or no difference between short- and long-term yields. The elbow is the highest point on the curve.

Why Does a Yield Elbow Matter?
Yield curves change all the time. Thus, the yield elbow, which signifies the maturity at which investors would earn the highest rate of interest on a particular type of bond, changes all the time too. (Remember, a yield curve only conveys information for a certain type of bond, not for all bonds.) Thus, investors usually look for signs in the economy that the elbow is about to peak or has peaked so they can act accordingly.
It is important to remember that yield curves change shape for a variety of reasons, which makes predicting elbows difficult. And in some cases, yield curves are flat and there is no real elbow at all.


