What is Support Level?
A support level is the price at which stock buyers jump in to purchase shares, establishing a floor beneath which it's difficult for the price to fall.
How Does Support Level Work?
Support, along with its cousin, resistance, are extremely important concepts in swing trading, and they are predicted by drawing horizontal trendlines on a stock price chart. These trendlines identify trading opportunities.
At least two highs or two lows in the same area are required to create a support level. The pattern gains greater validity every time the stock 'tests' price support levels by bouncing off of it.
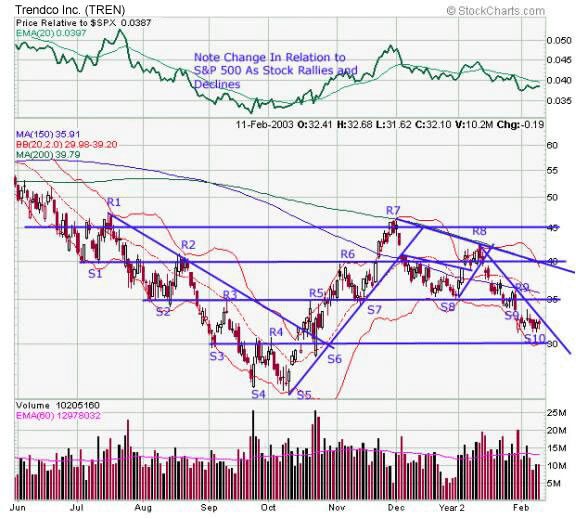
Let's look at a chart for the hypothetical stock TREN:

The chart shows the following:
> R1-S2. TREN trends sharply downward. It finds support in early August at $35, where it then moves sideways, or 'consolidates,' for several days.
> S2-R2. The shares rally briefly from roughly $35 to $40. Notice how we can connect R2 with S1 by using a straight line. What had been for a short time a support level has now turned into a resistance level.
> R2-S3. Between mid-August and early September the shares drop precipitously, from $40 to $30.
> S3-R3. The rally is brief. TREN recovers to $35. What had been support at S2, $35, has now turned into resistance at R3.
> R3-S4. A mid-September decline takes TREN from $35 to $27.
> S4-R4. TREN pushes back to $30, the level at which it had previously found support (at S3).
> R4-S5. The shares decline to their final early October low of just over $25.
Why Does Support Level Matter?
According to technical analysis, stock prices move within support and resistance levels. When these levels are broken, stocks are free to move into a new price pattern where new highs and new lows are established.
Once a stock hits a support (floor) or resistance (ceiling) level, it can easily retrace in the opposite direction. Stock traders use prices determined by support levels to set stop loss orders on their trades.
InvestingAnswers has several swing trading tutorials written by Dr. Melvin Pasternak, a leading expert in technical analysis. To learn more, read them here:
Swing Trading Support & Resistance -- learn two of the most important tools for analyzing a chart.


