What is a Rectangle Formation?
A rectangle formation describes a price pattern where supply and demand are in approximate balance for an extended period of time. In such a scenario, the shares tend to move in a narrow range, hitting resistance at the rectangle's top and finding support at its bottom.
How Does a Rectangle Formation Work?
A rectangle pattern reflects indecision, when neither the bulls nor bears can gain the upper hand. Ultimately, one side or the other wins the tug of war, and the shares break out or break down.
A break below support or above resistance creates a high-probability entry point for a trader. The alternation principle states that old support, once broken, becomes new resistance. The reverse is also true -- when old resistance is broken, it should then become new support.
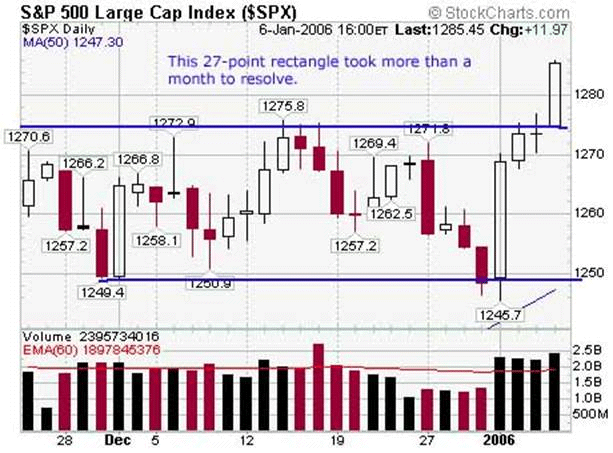
Targets can also be established using rectangles. According to the measuring principle, a stock or index should move the same approximate height after breaking out of the rectangle as it did within it. A rectangle in the S&P 500 is shown below:

Why Does a Rectangle Formation Matter?
In general, most traders prefer to trade rectangles only when the pattern has been resolved one way or another. While the formation doesn't typically yield enormous profits, it does usually provide traders with a high-percentage probability of generating a small profit on a breakout or breakdown. Considering rectangles often show a very clear stop and an explicit price target, it would be 'square' to ignore them.


