What is the Symmetrical Triangle?
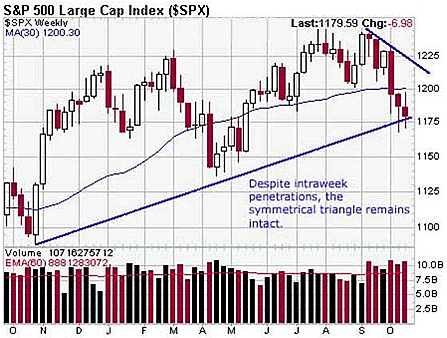
The symmetrical triangle is one of three important triangle patterns defined in classical technical analysis. The other two triangles are the bullish ascending triangle pattern and the bearish descending triangle pattern. The symmetrical triangle consists of simultaneous downtrend and uptrend lines. The length of the lines may be different. A typical example of a symmetrical triangle can be seen on the chart below:

How the Symmetrical Triangle Works
The symmetrical triangle pattern is notoriously difficult to predict. It depicts a situation where supply and demand have reached equilibrium. Typically, there will be a breakout to one side or the other before the price of the underlying stock or index reaches the apex of the triangle.
Symmetrical triangles often produce retracements -- also known as 'throwbacks' -- back to the trendline after a breakout has occurred. In the example above, if the index breaks out to the upside, then it would likely reset the downtrend line near 1220. That level should then serve as key support.
Why the Symmetrical Triangle Matters
Supply and demand seldom remain in equilibrium for long. Eventually either the bulls overwhelm the bears or vice-versa. When one side achieves victory, then a sharp trending move usually occurs in that direction. As such, the traders who have accurately noted the resolution of the symmetrical triangle stand to reap substantial profits.


