What Is Standard Deviation?
Standard deviation is a measure of how much an investment's returns can vary from its average return. It is a measure of volatility and, in turn, risk. Finding out the standard deviation as a measure of risk can show investors the historical volatility of investments. The higher the standard deviation, the more volatile or risky an investment may be.
Why Standard Deviation Is Important
Standard deviation is a measure of the risk that an investment will fluctuate from its expected return. The smaller an investment's standard deviation, the less volatile it is. The larger the standard deviation, the more dispersed those returns are and thus the riskier the investment is.
Many technical indicators (such as Bollinger Bands) incorporate the notion of standard deviation as a way to determine whether to buy or sell a stock. It’s important, however, to remember that standard deviation is only one of many measures of risk and should not be the last word in deciding whether a stock is 'too risky' or 'not risky enough.'
How Does Standard Deviation Work?
In investing, standard deviation is a useful tool because it helps investors look into security volatility and, in turn, predict performance trends. For example, an index fund generally has low standard deviation if it’s properly diversified (since the fund is trying to replicate the benchmark index).
If an investment has a lower standard deviation, that doesn’t necessarily mean that it’s the preferred option. It depends on whether the investor is willing to assume risk and the type of investments involved. In essence, conservative investors may be more comfortable with a strategy that has a lower-than-average volatility whereas more aggressive ones may not.
No matter what someone chooses, standard deviation for investments is one of the key factors that is used to measure risk. It’s easy to understand and, therefore, regularly reported to investors and clients.
What Is the Formula for Standard Deviation?

Where:
- ri = actual rate of return
- r ave = rate of return
- n = number of time periods
Note: For math-oriented readers, standard deviation is the square root of the variance.
How Do You Calculate Standard Deviation?
Calculating the standard deviation involves finding the mean value, which can be done by adding up all relevant data points and dividing it by the number of data points used. Then, calculate the variance for each data point by subtracting the mean from the value of each data point. Each result is then squared and summed together. Then it’ll be divided by the number of data points with one less.
To find the standard deviation, you’ll then need to find the square root of the variance.
Example of Standard Deviation Using Investments
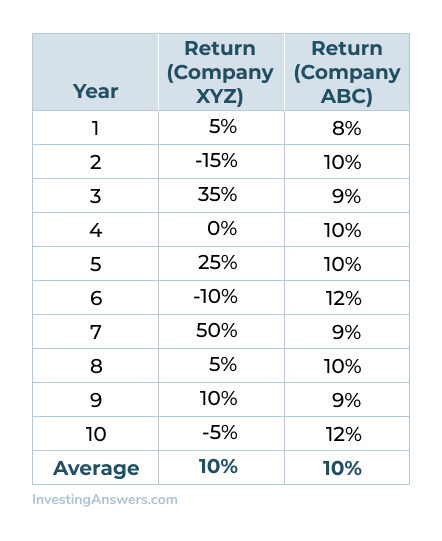
Let’s say you invest in Company XYZ which has returned an average of 10% per year for the last 10 years. We’ll compare how risky this stock is compared to Company ABC.
We’ll take a closer look at the year-by-year returns that compose that average:

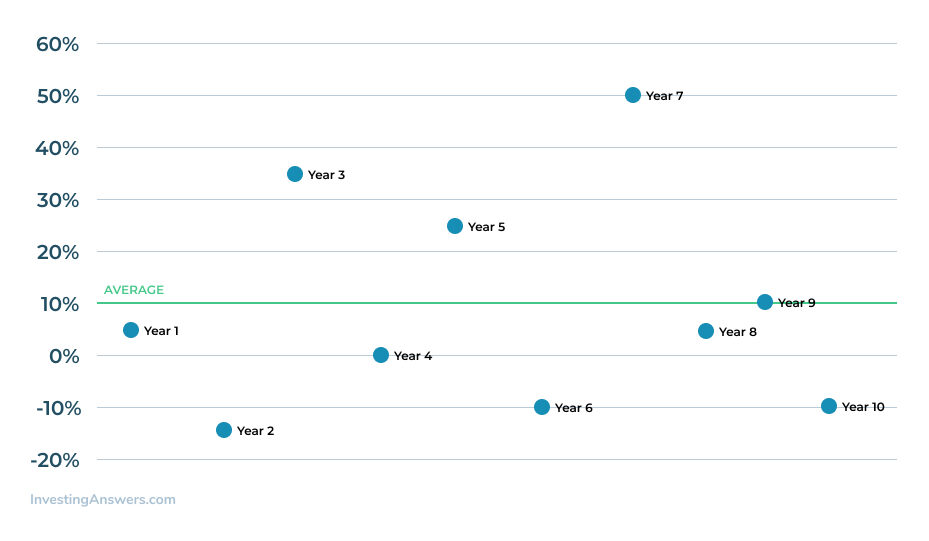
At first glance, the average return for both stocks over the last 10 years was 10%. However, let's look at how close XYZ's returns – in any given year – were to the average 10%:

In the chart above, Company XYZ only averaged a 10% return during Year 9. In the other years, the return was much higher (ie. Year 7) or much lower (Year 2).
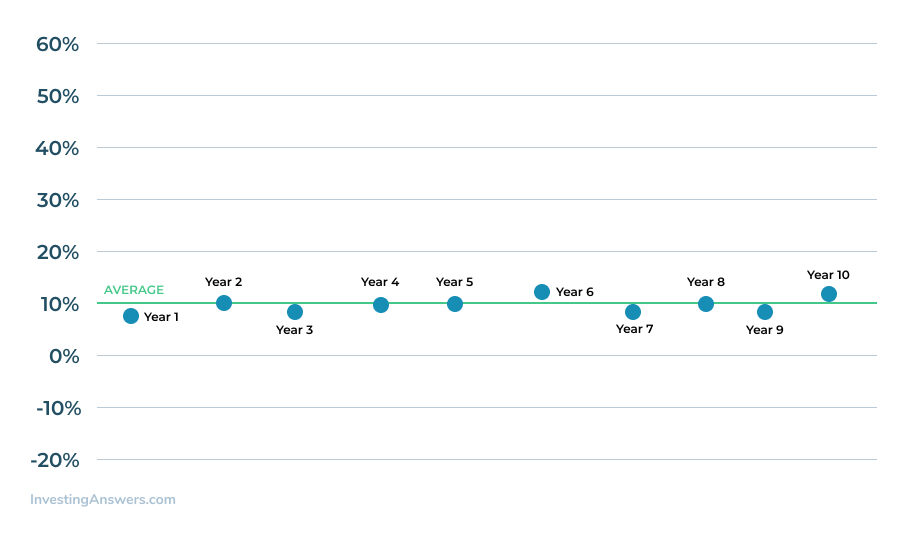
Continuing on, let’s take a look at the annual returns on Company ABC stock, which also had a 10% average return for the last 10 years:

Company ABC also averaged 10% return over 10 years, but it did so with far less variance than Company XYZ. Its returns are more tightly clustered around that 10% average. It’s safe to assume that Company XYZ is more volatile than Company ABC stock.
Now that we see which company seems less risky, let’s take a look at how standard deviation in investments seeks to measure this volatility by calculating how 'far away' the returns tend to be from the average over time.
Measuring Volatility
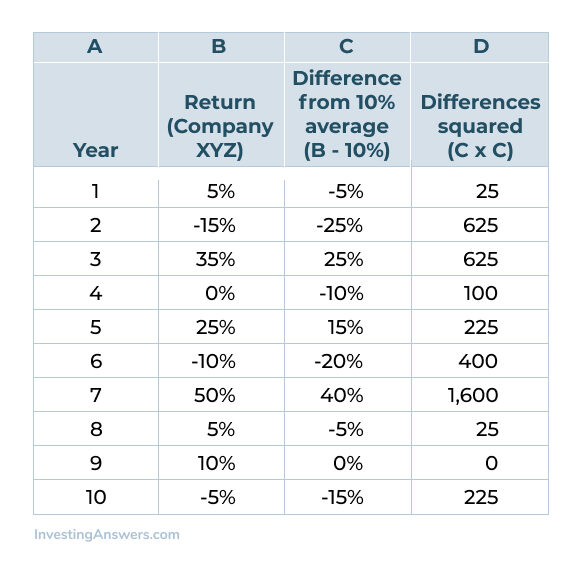
Let’s start by calculating the standard deviation for Company XYZ stock. Using the formula above, we first subtract each year's actual return from the average return, then square those differences (that is, multiply each difference by itself):

Next, we add up column D (3,850), then divide that number by the number of time periods minus one (10-1=9). This is called the unbiased approach and it’s important to remember that some investors calculate standard deviation using all time periods (10 in this case, rather than nine).
Then we take the square root of the result::
Standard deviation = √(3,850/9) = √427.78 = 0.2068 or 20.68%.
Using the same process, we can calculate that the standard deviation for the less volatile Company ABC stock is a much lower 0.0129 or 1.29%.
This means that for XYZ, the return is expected to be 10%, but 68% of the time it could be as much as 30% or as little as -10%. In general, investors can use the standard deviation to estimate the likelihood of returns falling within a range of possible returns.
Standard Deviation Calculator
You can use a standard deviation calculator to assist you in your calculations. The calculator uses your data set then shows what work is required to arrive at the standard deviation. Depending on the calculator, you can enter your data using spaces, commas, or lines breaks.
How Standard Deviation Is Calculated in Excel
Calculating the standard deviation in Excel can make the process much easier. To start, you’ll need to use the correct formula: For calculations for the sample standard deviation, use STDEV.S (older versions may be allied STDEV). To calculate for the entire population, use STDEV.P, STDEVPA, and STDEVP.
Note: For simplicity’s sake, we’re calculating a simple standard deviation.
This formula (which only uses numerical values), uses Number1 and Number2 as part of the formula. Number1 is the mandatory argument and corresponds to the first element in your sample data. Use a named range or a single array here. Number 2 is considered the option argument and can be a named range, single array, or data point. You can use up 254 data points.
For example, you have a data set for a sample population for 1 data point. Starting in column A, your formula could look like this: =STDEV.S(A2:A15)
Say there’s a dataset for a range of weights from a sample of a population. Using the numbers listed in column A, the formula will look like this when applied: =STDEV.S(A2:A15). Excel will then provide you with the standard deviation and the average of the applied data.
Can Standard Deviation Be Negative?
No, it cannot. This is because calculating standard deviation is based in the square root of a number, and square roots are always the positive root, by convention.
What Is a Good Standard Deviation?
There isn’t a standard benchmark of what is considered a “good” standard deviation – it all depends on your investing goals. For someone who wants to be less risky with their portfolio, a high standard deviation would be considered “bad”, whereas someone who desires to be more aggressive would consider it “good”.
How Standard Deviation Relates to Risk
Standard deviation is calculated to indicate risk or market volatility. The wider the range and more unpredictable the prices are, the greater the risk. In other words, investments with a larger trading range (or a tendency to spike or reverse suddenly) means they’re much riskier.
An underlying assumption of using standard deviation in this manner is that most price activity follows a normal pattern of distribution. In a normal distribution, you’ll typically see that individual values will fall within one standard deviation of the mean 68% of the time (and ones within two standard deviations 95% of the time).
Are Standard Deviation and Variance the Same?
No. Standard deviation is the square root of the variance.
Variance on the other hand, is found by taking the mean of a set amount of data points. Subtract the mean from each data point individually and square each result. Once you have those results, you use them to calculate the mean of each square.
Whereas both standard deviation and variance looks at risk, the variance tends to be more difficult to understand. That’s because the results may be not expressed meaningfully as the original data set on the same graph.
Are Standard Deviation and Standard Error the Same?
No. The standard deviation measures the amount of volatility or risk, whereas the standard error measures how accurate the sample mean data is in comparison to the true population mean.
How Standard Deviation Relates to Probability
In essence, probability offers information about what someone can expect in terms of long-term results. In other words, it can help investors determine or predict how an investment will fare over time.
Standard deviation can be used to determine the volatility of an investment using historical data. This can help an investor predict what may happen in the future.


