What is a Relative Strength Line?
The relative strength line compares a stock's price performance against that of the overall market, usually as measured by the S&P 500. However, if the trader desires, the comparison can be made to another stock or index.
How Does a Relative Strength Line Work?
The relative strength line can be evaluated using three key technical tools: trendlines, support and resistance lines, and price patterns.
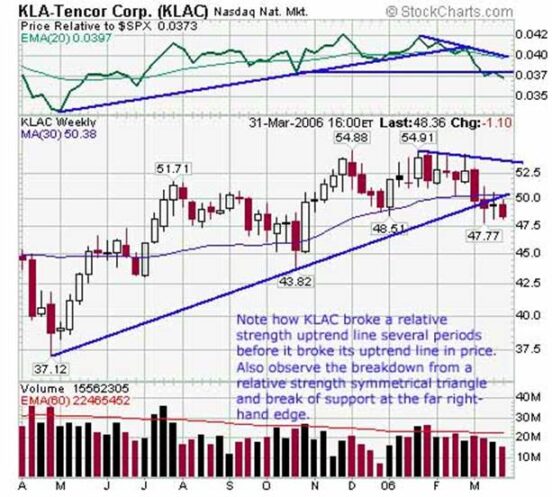
Many investors are familiar with uptrend and downtrend lines drawn on a price chart, but trendlines can also be equally helpful on the relative strength chart. In many cases, the trendline in relative strength will be penetrated before the trendline on the price chart, thus giving advance warning of a breakout.
Traders can also profitably analyze the relative strength line with support and resistance, as well as 'price' patterns. Support and resistance lines can be drawn on a relative strength chart, just as they can on a price chart. When analyzing a stock or index, traders can derive patterns by combining trendlines with support and resistance lines. This is also true when interpreting the relative strength line, where a variety of ascending, descending and symmetrical triangles can form.
During a period of market correction, one method to spot future leaders is to look for stocks whose relative strength line remains in an uptrend. When strength returns to the market, check to see if the relative strength line then breaks resistance. During a pullback, a stock's price may decline along with the overall market. However, if the relative strength line trends higher and breaks resistance, then it tells the swing trader that the stock is likely to outperform the S&P.
The chart below illustrates a relative strength line. note how the stock broke its relative strength uptrend line slightly before its price downtrend line. The shares have also broken a horizontal support level on the relative strength line.

Why Does a Relative Strength Line Matter?
When working with relative strength lines, swing traders should identify trendlines, support and resistance, and price patterns. Look for breakouts above relative strength resistance to identify stocks that are poised to do the same on the price chart. Conversely, spotting those that have broken down in relative strength may help pinpoint stocks that are ready to break below important support. When used in these ways, relative strength is a simple tool, but also a very powerful one.


