Trendlines are one of the most common and helpful tools in a trader's kit. They are used to show a stock's upwards, downwards, and sometime sideways, movement.
As I mentioned in my recent article, The Trend Is Your Friend (where I described trendlines in-depth), confirmed trendlines are drawn by connecting a cycle low, or high, with at least two other of the highest or lowest points on a chart, to create a line of best fit.
Just as a trendline is drawn parallel to the stock's movement on a price chart, it can also be drawn on the RSI line.
To draw an RSI uptrend line, connect three or more points on the RSI line as it rises. A down trendline is drawn by connecting three or more points on the RSI line as it falls.
And, just as with a stock, the break of an RSI trendline can indicate a potential trend reversal. However, the breaking of an RSI trendline usually precedes the break of a trendline on the price chart, providing an advance warning of a stock's reversal. Therefore, recognizing the break of the RSI trendline can be an important and profitable indicator that the stock's direction is about to change.
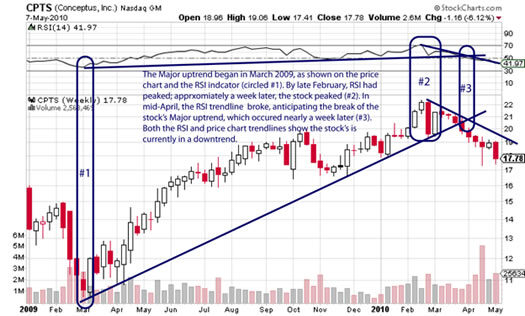
The chart of Conceptus Inc (Nasdaq: CPTS) provides a good example of why traders should pay attention to the breaking of an RSI trendline.

On the price chart, Conceptus hit a low of $10.26 in March 2009. Around this same time, RSI bottomed near 33.
During the next year, both the stock and RSI climbed steadily higher. CPTS hit a peak of $22.44 the last week of February, but, RSI peaked about a week beforehand, near the overbought 70 level. Immediately after, RSI began falling, coincident with price.
The major RSI up trendline broke in mid-April, which had lasted more than a year. That trendline break took place about one week ahead of the break in the uptrend line of the stock. note how the breaking of the RSI trendline warned of the coming reversal in the stock's uptrend.
CPTS is currently below its intermediate-term downtrend line. RSI is below 50 and dropping, providing an indication the stock will likely continue to fall. Since the deeply oversold level on RSI is not met until 30, CPTS' price could deteriorate significantly from current levels.
By using RSI trendlines, you can add anticipate an underlying trendline break. When it does occur, you have additional and potentially profitable certainty that you have read the chart -- and the stock's direction -- correctly.
If you want to learn more about using technical analysis in your portfolio, check out: Double Top Formations Explained


