The head and shoulders pattern a highly-reliable technical formation that signifies a reversal in a stock's trend.
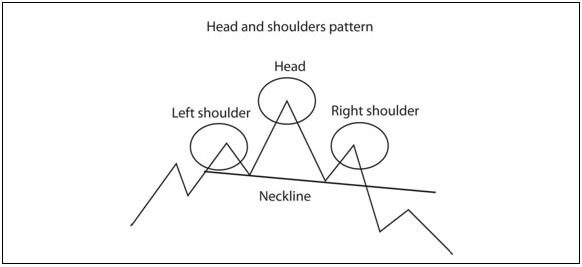
As you can see in the figure below, the pattern is named because it looks like a person's head and shoulders.

The head and shoulders pattern consists of four distinct parts: The left shoulder, the head, the right shoulder, and the neckline. Each of these four must be present for the formation to exist.
The Left Shoulder: Visualize a stock rising from $55 to $85, a gain of more than +50%. Next, suppose the stock then hits a short-term peak and forms a doji candle on the heaviest volume in several months. The left shoulder often starts with a period of heavy volume. Then, the stock moves sideways between $80 and $85 for several weeks.
The Head: After several weeks of consolidation, assume that a low volume breakout to just under $90 occurs. note that the head ($90) is noticeably above the left shoulder ($85). It should 'stick out' as part of the pattern. Volume on this new high should ideally be below the volume of the left shoulder. This is negative volume divergence, which occurs when price goes to a new high, but volume does not make a corresponding peak -- a key warning.
The Right Shoulder: Immediately after the peak near $90, there should a high volume sell-off, with the stock pulling back to just above $80 support. The shares will then rally back to $85 on tepid volume.
The Neckline: In this particular example, what I've identified as $80 support is actually the neckline of the head and shoulders formation. The neckline is drawn across the lows of the left and right shoulders. Most frequently, it is drawn horizontally, but it can also be drawn diagonally, sloping either up or down. When the neckline is broken, the stock is in a confirmed head and shoulders pattern. Sometimes a 'filter' of either 3% or two trading days is necessary to insure that the pattern is not a 'false breakout' to the downside.
Often a stock will retest the neckline. If the pattern is a genuine head and shoulders, it will typically fail at the previous neckline and offer a second shorting opportunity.
The Inverted Head and Shoulders Pattern
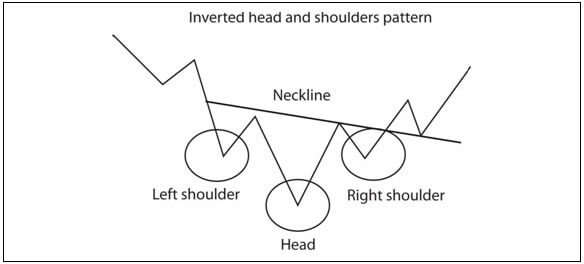
The head and shoulders pattern can also be inverted. In this case, the formation is bullish because it appears downwards, signifying the breaking of a downtrend.

With the inverted head and shoulders pattern, buying and selling activity, as well as volume, are opposite.
The inverted left shoulder is created on increased volume. The inverted head will be formed on lighter volume. However, the rally from the head to the peak of the right shoulder will typically occur with greater volume than seen during the creation of the left shoulder. Once the peak of the right shoulder has formed, volume will dramatically decline. But, as the stock pushes past the neckline, volume will spike, along with the stock price.
Applying the Head and Shoulders Pattern
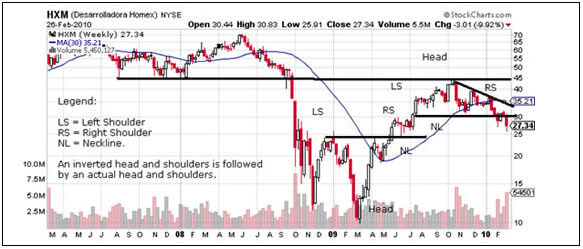
The 3-year weekly chart of Mexican housing development company Homex Development Corp (NYSE: HXM) provides a good example of both the inverted and traditional head and shoulders formations.
As shown on the chart, an inverted head and shoulders pattern began forming in early January 2009. The left shoulder was created during relatively low volume. The head formed as the stock -- and the rest of the market -- tumbled to a low in March. Price and volume both increased as the right shoulder formed in May. The stock rallied through the neckline and gained nearly +40%, going from $25 to $35 in four months.

But just as HXM reached $35 in the fall of 2009, its technical direction began to change. At this point the stock filled in a gap that occurred in late September 2009. Soon after, the left shoulder of the traditional head and shoulder pattern formed. The head appeared in October as the stock went to a high of $45. At this time, Mexico's currency, the peso, was up +4.4% from the previous month, boosting Mexican companies as a whole.
However, after the stock hit $45, it encountered resistance. The $45 area had been a support area in mid-2007 to early 2008. Old support had turned into new resistance. After a small head formed, the shares began to fall rapidly, forming the right shoulder between roughly $32 and $36. In late-January to early-February 2010, HXM fell hit $30, forming the neckline of pattern. The neckline is seen by drawing a line through the lowest point of each shoulder. In February, the stock broke below the neckline at $30 and fell rapidly. However, technical theory says HXM has much further to drop.
To calculate how much HXM will go down, we can apply the head and shoulder's measuring principle. We first calculate the breakout by measuring from the top of the head down to the neckline ($45 - $32 = $13). Next, we subtract the neckline from the breakout to obtain our target ($32 - $13 = $19). Our target price is therefore $19.


