Compound Annual Growth Rate (CAGR) vs. annualized return – what’s the difference? While many investors count on compounding to help them achieve financial independence, many confuse CAGR for annualized average return. And when financial advisors and brokers quote annualized return, this can cause even more confusion. Let’s unravel the two.
CAGR vs Annualized Return: How Are They Different?
Although compound annual growth rate is often confused with annualized return, there are several differences.
CAGR
Imagine you have $10,000. This year, your $10,000 grows 100%, leaving you with $20,000. The following year, your investment falls 50%, taking you back to your original amount, $10,000.
Over those two years, your annualized gain is zero (you haven’t made or lost any money). The zero-percent is known as the Compound Annual Growth Rate (CAGR).

An advisor who’s eager to put a positive spin on the situation may tell you that your return is actually 25%, but that number would be your average annual return – and it’s actually very misleading. If your investment had earned 25%, wouldn't you have more than when you started?
Use The CAGR Calculator;
Our easy to use CAGR Calculator can help you project the CAGR you need to achieve investment goals or measure the return on existing investments.
Average Annual Return
In the example above, you have 0% gain when using the CAGR calculation – but you have 25% gain when using the average annual return equation. That’s because average annual return doesn’t account for compounding: It’s a calculation that takes each year’s growth rate, adds them together, and then divides by the number of years totaled.

How Are CAGR and Annualized Average Return Used?
Annualized Average Return is an easier computation and can often be completed by hand. Therefore it’s more commonly used to quickly gauge an investment’s performance.
The annualized average return is commonly found in financial statements (such as a mutual fund’s prospectus). It shows the investment returns over a series of time periods and is more commonly used in corporate finance.
CAGR vs. AAGR: Market Volatility
The greater market volatility, the larger the drop in the compound return. And there are two factors that contribute to volatility: negative returns and the distribution of the returns.
1. The Effects of Negative Returns
You’ve worked hard to save $100,000 and want to invest it in the market. In the first year, you earn 15% on your $100,000, increasing the value of your portfolio to $115,000. In the second year, the market drops and your portfolio falls 15%.
How much is your portfolio worth now? If you guessed $100,000, then you've just fallen for “compounding's revenge.” Sure, your average annual return breaks even at 0.0%, but if you actually stop and do the math, you'll discover that you've actually lost money.
How? After the 15% drop, your portfolio was worth $97,750. Your compound annual return was -1.13%.

Whenever you lose money, it takes a greater return to just break even. If you lose 20%, you’ll need to earn 25% to get back to your starting point. The more you lose, the worse the situation gets. For example, if you lost 50%, you’d have to double your money (grow it by 100%) to balance things out.
2. Distribution of Returns
The second reason why average annual returns are so misleading: distribution of returns. As the distribution of returns widens, the compound returns shrink.
In the illustration below, the average return over the three-year period is 10%.
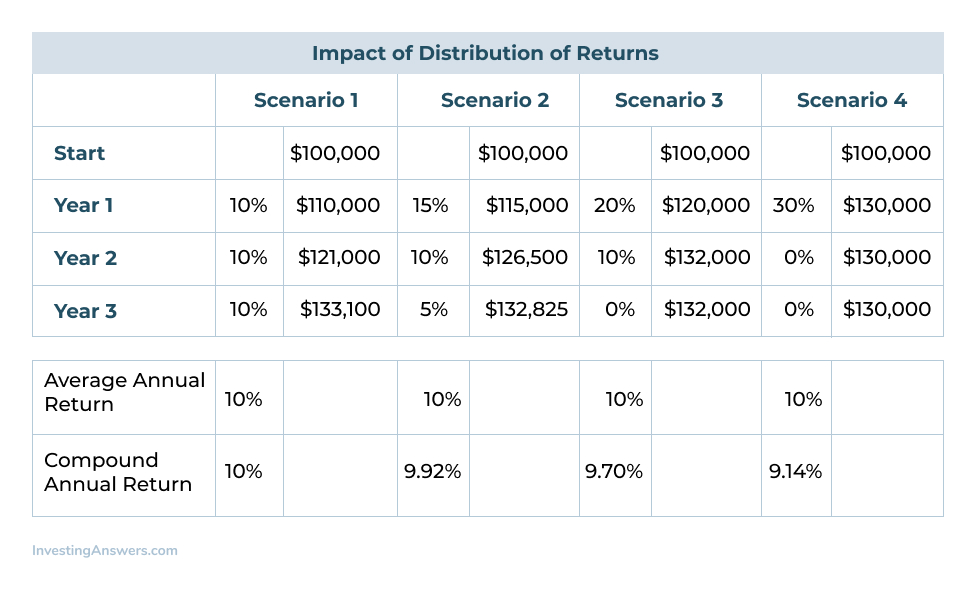
The first scenario is basic: Each year, your portfolio grows by 10%. At the end of the three years, both your compound return and your average annual return are 10%.
But look at the second, third, and fourth scenarios: Your average annual return remains 10%, but the actual value of each portfolio is lower.
In Scenario 2, you still have an average annual return of 10% but the value of the portfolio is lower due to a wider distribution of returns. When you add Scenarios 3 and 4 to the picture, a trend emerges: The greater the distribution of returns, the lower the compound returns you receive.