What is On Balance Volume (OBV)?
On Balance Volume (OBV) was designed by Joseph Granville to track the flow of volume in and out of a stock or index. Essentially, OBV is a running total of volume. An OBV line typically takes the form of a zig-zag. It can trend up (a bullish sign), down (a bearish sign) or sideways (in which case the OBV trend is uncertain).
How Does On Balance Volume (OBV) Work?
Designed in the early 1960s before computers were used in stock analysis, the OBV calculation is rather simple. An arbitrary number is used to begin an OBV line. On days when a stock's price closes higher, all the volume of that day is added to this line. On days when it closes lower, the volume is subtracted from the line.
For example, let's say that Company XYZ's stock went from $20 to $21 in a day and 100,000 shares changed hands. The next day, it retreated back exactly to $20, but traded only 50,000 shares. Even though XYZ finished right where it started at $20, the OBV line would have increased by +50,000 -- the difference in trading volume between day #1 and day #2.
If this same pattern were to repeat itself for several days in a row, then the stock's price would remain constant, yet it would have a rising OBV line. Granville would argue that this situation is highly bullish. In theory, this hidden demand will eventually surface and force prices higher.
When analyzed in conjunction with the price chart, the OBV line can do one of three things. First, it can confirm the price movement, trending upward as prices rise. Second, it can diverge bullishly or bearishly from price. A bearish divergence would occur when prices hit a new high, but the OBV line makes a lower high. Conversely, a bullish divergence occurs when prices hit a new low, but the OBV line makes a higher low. Finally, the OBV line can act as a leading indicator. If OBV breaks out to a new high, but the price of the underlying security remains below the previous high, then the price may follow it to higher ground.
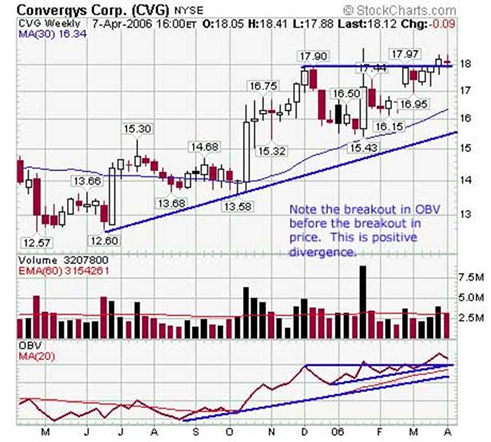
Traders can also analyze OBV by examining trendlines and moving averages. A weekly chart of Convergys (CVG) is analyzed below. note how CVG is in an uptrend and trading above its 20-period moving average. Most importantly, the stock shows bullish divergence, with the OBV line having broken out before a breakout in price at the mid-$18 level.

Why Does On Balance Volume (OBV) Matter?
Many technical analysis tools (such as moving averages) are referred to as 'lagging indicators' because they describe changes in pattern after the fact. OBV is one of the few tools that can serve as a leading indicator, forecasting price changes before they take place. Investors should take notice when OBV diverges from the underlying price action.


