Volatility is defined as how quickly prices move. Traders can use technical analysis to assess volatility by using the Chicago Board Options Exchange Volatility Index (Chicago Options: $VIX).
This index indicates the current level of bullish or bearish sentiment. In essence, it gauges traders' fear levels. Understanding the current level of sentiment can be useful for anticipating market trends and movements.
The Volatility Index is calculated by the Chicago Board Options Exchange (CBOE). The CBOE determines expected volatility by tracking the prices traders pay for puts and calls on the S&P 500 options series. This information is then compiled into what is called a 'synthetic option.' An overall volatility reading is then calculated, based on:
The market price of the S&P 500
The prevailing interest rate
The number of days to expiration of the option series purchased
The strike prices of those options contracts
The volatility index is a contrary indicator. Low readings on the Volatility Index indicate calm. When there is little volatility, traders generally lack significant levels of fear. During these periods, call buying -- a bet that the market will move higher -- typically outnumbers purchases of puts, or bets that the market will move lower.
But, when the market moves sharply lower, as it has done during the past few weeks, anxiety rises. Traders typically rush to buy puts to protect themselves. The increased number of investors willing to pay for put options shows up in higher readings on the Volatility Index. Higher readings typically represent fear.
Paradoxically, a market that is filled with fear is also apt to be oversold and can turn higher quickly. Short-covering can then take over, resulting in sudden and seemingly unexpected rallies.
To determine when market complacency and fear are strong, some market observers assign fixed levels to the Volatility Index. These levels change depending on recent history. Currently, if the index rises above 30, it shows fear is increasing. Anything above 45 shows strong fear. Anything in the range of 20 to 25 shows relative calm.
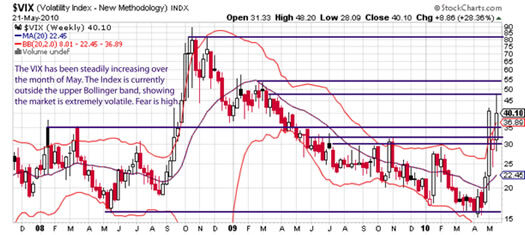
The chart below depicts the $VIX during the past year and a half.

As you can see, the level of fear peaked in the fall of 2008, coincident with the Lehman Brothers' bankruptcy, and fears about the possible collapse of the financial system. At that time, the $VIX skyrocketed to near 90.
As fears about the survival of the financial system receded, so did the $VIX. When the S&P hit its actual bottom in March 2009, typical $VIX readings were 40-55.
Since March 2009, support on the $VIX has been about 15, with resistance about 30. In the past few weeks, however, the $VIX has spiked with the SEC's investigation of Goldman Sachs, the 'flash crash,' the BP oil spill and renewed fears over Europe's debt.
The index is currently at very high levels relative to its recent past. On Thursday, the $VIX spiked 30%, reaching a 14-month high of 45.48. The index closed the week at 40.10.
The $VIX is also currently outside the upper Bollinger band, indicating -- not surprisingly -- that the market is very fearful.
The cross-over of the 20-period moving average, as happened during the week of May 3, signifies an important change in the $VIX's behavior.
As the market returns to an uptrend, two important signs will likely occur. First, the $VIX will probably drop below the 20-period moving average. Second, the index will likely pull back within its upper Bollinger band. This pullback will most likely correlate with the market forming a tradable base. But, it could take several weeks -- if not months -- to occur.
In the meanwhile, any market turns upward may be sharp and swift, but are not likely to be long-lasting. In such a market it is easy to get whipsawed, and traders must be extremely nimble. I recommend taking smaller-than-normal positions until the volatility subsides. I will monitor the volatility index in conjunction with the S&P chart and will alert you when I believe it is safe to 'return to the waters.'


