What is a Hammer Candlestick?
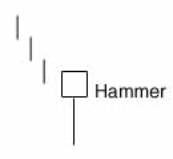
The hammer candlestick is a technical indicator that typically appears after a prolonged downtrend. Here is an example of a hammer candlestick:

How Does a Hammer Candlestick Work?
During the period of the hammer candlestick, the stock or index experiences strong selling. As the day or week goes on, however, it recovers and closes near the unchanged mark -- and sometimes ecien higher. In these cases, the market is potentially 'hammering' out a bottom.
To be an official hammer, the lower shadow must be at least twice the height of the real body. The larger the lower shadow, the more significant the candle becomes. The IMF is also more noteworthy if the lower shadow penetrates the bottom Bollinger Band ® and the real body closes back within the band. On a weekly chart, a hammer candle formed near the 40-week moving average suggests that average is seen by the market as strong support.
As with all candles, the 'rule of two' applies. That is to say, a single candle may give a strong message, but one should always wait for confirmation from another candle before taking any trading action. However, it may not be necessary to wait an entire trading week for this confirmation.
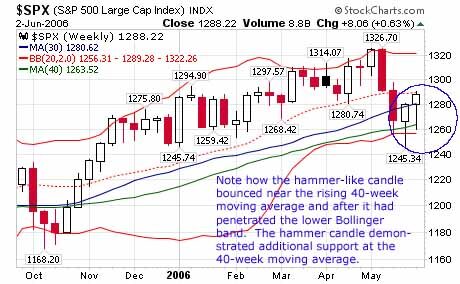
In the historical chart of the S&P below, the last two candles appear to be hammers. The next to last one is what we call a 'hammer-like' candle, since the lower shadow is not twice the height of the real body. The second one, however, is a true hammer, despite the very small shadow. Note how the first hammer-like candle was made outside the lower Bollinger Band, and that post candles were formed near support from the rising 40-week moving average. That suggests there is strong support at this moving average.

Why Does a Hammer Candlestick Matter?
Hammer candlesticks should be an integral part of all traders' visual identification skills. When combined with moving averages and indicators, these candles can warn of important trend reversals.


