What is the Arms Index (Trin)?
The Arms Index (Trin) uses the ratio of advancing issues to declining issues to signal when the market is deeply overbought or oversold.
How Does the Arms Index (Trin) Work?
The Arms Index is named after its designer, Richard Arms. It is also known as 'Trin,' which stands for the 'Trading Index.'
The Arms Index compares the relation of advancing issues to declining issues (stocks up at least a penny on the day versus stocks that have declined at least a penny) as well as the relation of advancing volume to the declining volume (the total volume of all stocks that closed higher on the day versus the total volume of all stocks that closed lower).
It is calculated using the following formula =
(Advancing / Declining Issues) / (Advancing / Declining Volume)
To calculate the Arms Index, we will use the figures for all trading on the NYSE on a specific day:
Advancing Issues: 783
Declining Issues: 2542
Up Volume: 254 million shares
Down Volume: 1,612 million shares
Using the above formula, the calculation would go as follows:
Advancing/Declining Issues: 783/2542 = 0.371
Advancing/Declining Volume: 254/1612 = 0.157
Arms Index Calculation: .371/.157 = 2.35
The Arms Index for the above day was 2.35. 2.35 tells us that far more volume went into the stocks that were declining than into stocks that were advancing. If the two ratios had been proportionate, then the Arms Index would have come in at 1.0. An Arms Index reading of 2.35 indicates that on this day there was very heavy selling pressure in stocks that moved lower.
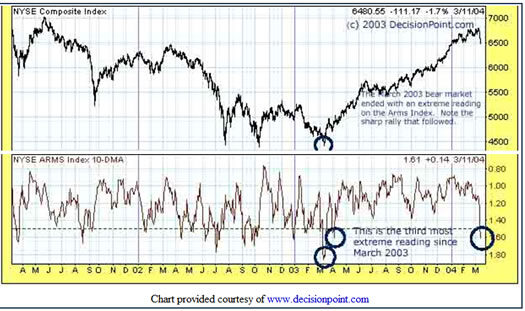
Since individual daily readings can be quite volatile, the Arms Index is generally displayed as a 10-day simple moving average plotted on a scale. When this 10-day moving average falls below 0.80, the market is considered to be overbought. When the moving average reaches 1.20, the market is said to be oversold. The Arms Index tends to remain in this 0.80 to 1.20 range the majority of the time.
You'll usually find the Arms Index plotted alongside the New York Stock Exchange (NYSE) Index. Since that index contains every stock listed on the exchange, it is seen as the best proxy for that overall market. (You can also calculate an Arms Index for any other market, such as the Nasdaq Composite.)

In the first circle, the 10-day moving average of the Arms Index closed at 1.61. That is the third most oversold reading seen during this example time period. It is also approaching the 1.8 level that marked the launch of the bull market last March. Such an extreme reading, may indicate that the market should shortly experience a very strong snapback rally.
Why Does the Arms Index (Trin) Matter?
An Arms Index value below 1 usually indicates bullish sentiment, and a value above 1 is bearish. The index was introduced by Richard Arms, and is continuously displayed during trading hours, among other indices, on the New York Stock Exchange's central wall display for the stocks traded on that exchange.
Stochastics and RSI are generally the most common measures of overbought and oversold. Both indicators are based on a stock's price in relation to its own trading range. The Arms Index is based on the overall performance of the market itself, more specifically, its breadth and volume.


