What is Correlation?
Correlation, as used in investing, is a measure of the return performance of two (or more) securities or asset classes relative to each other. Portfolio managers, traders, brokers, and stock analysts use correlation to estimate the effectiveness of diversification to decrease risk and optimize portfolio performance in different market conditions.
Correlation Coefficient Explanation and Examples
Correlation is reflected by a statistic known as the correlation coefficient. This statistic conveys the strength and the direction of the relationship between two securities’ returns. It is a number between +1.0 and -1.0.
The sign of the correlation coefficient indicates direction: when it is positive (>0), there is positive correlation and the two securities returns’ move in the same direction. When it is negative (<0), there is negative correlation and the two securities’ returns move in opposite directions.
The quantity of the statistic (between +1.0 and -1.0) indicates the strength of the relationship, based on the pace that each security moves. As the absolute value of the coefficient is closer to 1.0, the relationship is stronger. As the absolute value of the coefficient approaches 0, the relationship is weaker.
A correlation coefficient of zero indicates no relationship at all.
Positive Correlation Examples
When the correlation coefficient is between 0 and 1, there is a positive correlation, indicating that the two securities move in the same direction but not at the same pace. When the correlation coefficient is exactly +1.0 it’s called a perfect correlation. This indicates that the two securities move at the same pace and in the same direction.
Portfolio managers may choose investments with positive correlations to magnify returns if markets goes in the direction they predict. For example, if the portfolio manager expects the US economy to grow in future months and years, they may decide to invest in US stocks and US real estate, which are often positively correlated. This move would offer the portfolio diversification, as one of those two investments may grow faster than the other, assuming the portfolio manager's prediction of positive growth for both assets is accurate.
Negative Correlation Examples
When the correlation coefficient is between 0 and -1, there is a negative correlation, indicating that the two securities move in oposite directions and not at the same pace. When the correlation coefficient is exactly -1.0 two securities move at the same pace but in opposite directions.
By choosing a mix of investments with negative correlations, portfolio managers can afford to have losses in some of their investments because other investments are then expected to have gains. For example, if the economy is doing well and businesses are becoming more profitable, stocks in the portfolio may gain in value while gold falls a bit in value as it becomes relatively less desirable. On the other hand, if the economy is in recession and businesses are losing money, the value of stocks may fall while gold rises in value as investors have historically viewed the precious metal as a safe haven and a reliable store of value.
Correlation Coefficient Formula
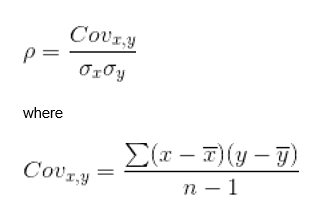
To calculate the correlation of two investment securities, use the correlation coefficient formula:

Simply put, we are taking the covarience divided by the securities' standard deviations to find our correlation coefficient between two investments.
Here we'll break down the formula to simplify. First we'll start with the symbol on the left (the greek letter rho), which is used to express the normalized covarience of the two securities' returns that you're comparing.
Now, on to the numerator of the formula on top -- the covariance. The covariance (which is expressed in more detail in the formula below 'where') calculates how far and how often each security varies from its mean or average performance.
In the denominator of the formula on top (little sigma x multiplied by little sigma y) are the securities' standard deviations. .


