As you may already know, the double top is a major bearish reversal pattern. It marks a significant, long-term change in a stock's trend, from up to down.
It is also one of the most commonly seen -- and commonly misunderstood -- chart patterns. As a result, it is important to correctly analyze this formation.
As the name implies, a double top develops when two distinct tops occur at approximately the same price level. The formation resembles an 'M' on the chart.
When the stock touches the same level twice after a sustained incline, it creates a potential double top. However, it is not until the intervening low is exceeded that a confirmed double top occurs.
Like the double bottom, the significance of this pattern can be judged by three factors:
1) The length of time it takes to form.
2) The height of the pattern.
3) The number of shares traded while the pattern builds.
A major reversal takes many months to form, covers a large amount of distance on a chart, and involves a large number of shares traded. A reversal of intermediate significance may happen in a few months, has a relatively modest height and occurs on low volume.
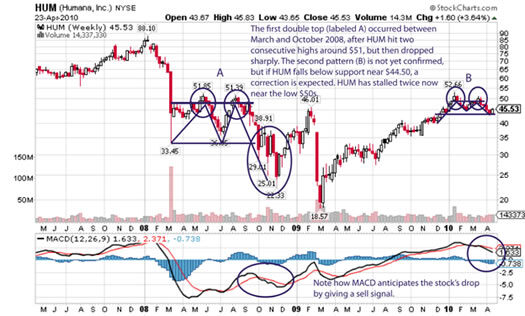
A chart of Humana stock, from April 23, 2010, shows a good example of two double-top formations.

As you can see, the first formation (marked A) began after HUM dropped, on high volume, in early March 2008. The stock rose to a high of around $51 in late May before falling to a low near $36 in July. Between July and August, the stock rose again to a peak near $51, creating a potential double top. The pattern was confirmed when the stock fell below the $36 range. Several months later, in November of that year, it traded near $22.
The second potential formation (marked B) has occurred this year. In January, the stock rose from around $44.50 to a high near $53, but encountered resistance at this level. After a temporary dip in February, the stock once again tested resistance, just above $52. But, again, unable to break past resistance, HUM fell. This chart shows the stock is in a downtrend trend and testing key support near $44.50. If it falls below this level, the double-top pattern will be confirmed.
note the MACD indicator during the formation of the double-top patterns. MACD anticipates the stock's drop by giving a sell signal.
I'd classify the confirmed double top (labelled A) as having intermediate significance because it took several months to achieve. Nonetheless, it had a crucial impact on the future direction of the stock.
The range of the pattern was between around $36 and $51. Almost 44% of the share price ($51-$36/$36) was involved. Volume was subdued during the period.
The potential double top (labelled B) -- if confirmed -- will likely also have intermediate significance; it's only been forming during the past four months.
The range of the pattern is between around $44.50 and $53. Almost 19% of the share price ($53-$44.50/$44.50) is involved. Volume has also been low during this period.
To determine how much profit you could make from acting on the resolution of this pattern, you can apply the measuring principle -- which I have discussed several times.
To calculate the measuring principle, take the height of the pattern, and add it to the breakout level. In this case, the height of the potential double top pattern is approximately $8 ($52.66-$44.50) and the breakout level is $44.50. Therefore, the target is around $36.50 ($44.50-$8).
Correctly identifying a double-top formation can be a profitable trading strategy. The next time you spot an 'M' on the chart it could equal big Money.
This article was originally sent to subscribers of Dr. Pasternak's 'Double-Digit Trading' service on April 26, 2010. The charts and stocks that are mentioned are used to illustrate how an investor can learn to use technical analysis to identify double top formations, and they should be used for educational purposes only.


