Supply and Demand: The Basic Principle of Economics and the Stock Market
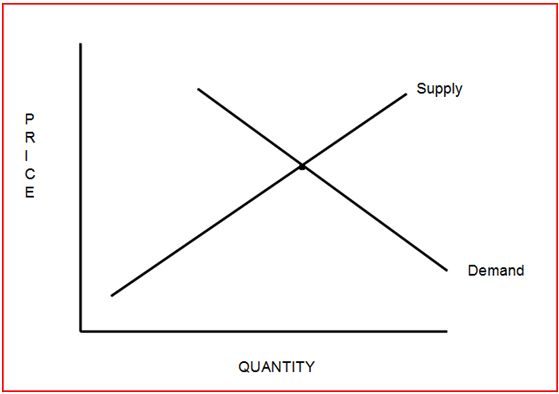
The laws of supply and demand are well known and they lie at the core of the study of economics. In its most basic form, the laws state that as prices increase, the quantity that sellers are willing to supply increases and the demand from buyers decreases. As prices fall, supply decreases and demand increases. This idea is illustrated in Figure 1. When supply equals demand, we get an equilibrium point where a transaction occurs.

Figure 1: Supply and demand are related to price. Sellers are willing to sell more at higher prices, but buyers are only willing to increase their consumption as prices decrease.
These laws apply to everything that is bought and sold, such as gasoline, newspapers, houses, or stocks. In the stock market, we see the laws in action in real time. Each transaction shows a point where we have found a price where someone is willing to sell and someone else is willing to buy. The equilibrium point changes constantly as the amount available for sale changes and buyer demand increases or decreases in relation to the perception of value. Figure 2 shows a stock chart with a single equilibrium point highlighted.
.jpg)
Figure 2: Each day results in a new equilibrium price, but each point on the line shows a price where supply exactly equals demand. An “X” shows how closely stocks follow the pattern seen in Figure 1.
Since all prices are determined by the laws of supply and demand, the stock market can be thought if nothing more than an economics laboratory.
What Causes Changes in Supply and Demand?
The economy is largely driven by consumer demand. About 70 percent of the US Gross Domestic Product (GDP) is related to consumer spending. GDP is reported quarterly, showing how big the economy is and the amount that the economy has grown or declined over the past quarter. The total size of the US economy at the end of 2008 was $14.3 trillion. It had experienced a 6.3 percent decline in the last quarter of the year. This was a relatively large change. Normal changes are between 1 and 3 percent and are usually positive.
Consumer spending, formally known as Personal Consumption Expenditures (PCE) by about 3 percent in the fourth quarter of 2008. Consumers, as a group, were spending less because unemployment had risen dramatically. Unemployment is a closely watched economic report that is released on the first Friday of every month. During 2008, the unemployment rate increased from 4.9 percent at the beginning of the year to 7.2 percent at the end of the year. This was also a larger than normal move in the data series.
With fewer Americans working, we see spending decline. This means there is less demand for goods and services being produced, and we see that in the declining GDP. The national economy is simply following the laws of supply and demand. It is attempting to adjust for the reduction in demand by reducing supply. If our theories are correct, we should also have seen prices decline in 2008.
The level of price changes is measured by the Consumer Price Index (CPI), which is commonly thought of as measuring the rate of inflation. If the CPI increases by 4 percent, we would say that prices increased by that amount, indicating an increase in demand that allowed suppliers to charge more for their goods. We’d expect to see an increase in supply follow this, and eventually prices settle into a new equilibrium. In 2008, unemployment rose, meaning that consumers had less money to spend. In this type of environment, we’d expect prices to decline or at least hold steady. In fact, CPI showed a 0.1 percent increase during the year, which means manufacturers were unable to increase prices because demand had decreased.
The Impact of Economics on Stocks
The stock market is a pricing mechanism. Investors evaluate the future prospects of a company, estimating future earnings to determine the fair value of the stock. They then try to find stocks they feel are trading below their true value. In time, they expect that other investors will realize their mistake and bid the price of the stock up to the level it should be. The health of the economy is one of the most important determinants of a company’s future profits.
Thinking about home builders, this idea is easy to understand. If the economy is good, people have jobs and are more likely to build new homes. New homes require mortgages, creating jobs in hat industry, and furniture, which creates jobs in that industry. The employees in these industries are able to spend more since they are not worried about their jobs, creating more jobs in restaurants and entertainment-related fields. Those employees also spend more, and these actions are what lead to economic growth. The opposite (decreased consumer spending) occurs in an economic slump.
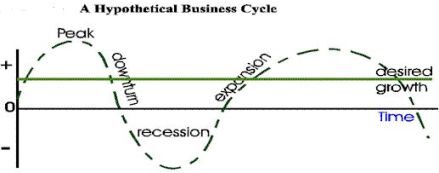
The economy moves through what is known as the business cycle, where different parts of the economy do better than others at various times. Figure 3, used in online classes at the University of Colorado, illustrates the business cycle. Economies always rotate through this cycle – after some time, we just don’t need to build any more new homes, and the economy peaks, the downturn eventually bottoms as the need for homes
increases, and the cycle repeats.

Figure 3: The idealized business cycle looks like this, in the real world it doesn’t move as neatly and there are irregular peaks and troughs as we move the through the complete cycle.
In the stock market, investors are looking forward; more interested in finding tomorrow’s winners than looking at stocks that did well last year. They know that different industries will do better at different phases of the business cycle. At the peak, they will be selling stocks that of companies that depend on big sales (like homebuilders, appliance manufacturers, and auto companies) to buy defensive companies that should do well in any economic environment (such as drug companies and utilities). At the bottom of the cycle, the opposite occurs and defensive companies are sold and speculative stocks are added to their portfolios based upon the expectations that spending will increase during the economic expansion.
The idea that different stocks will provide better performance at different times of the business cycle leads to the idea of sector rotation in the stock market. Applying this investment style means buying the stocks which will do best in the next stage of the economy and taking gains from the stocks bought in earlier stages. It can be profitable for investors with a basic understanding of economics.
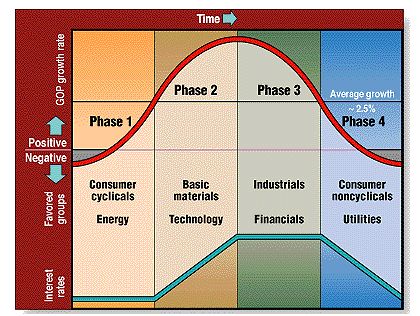
Just as the economy follows a business cycle, stock investors can follow a sector rotation model to invest in the most profitable sectors based on where the economy is (Figure 4).

Figure 4: This model, developed by Paul and Carole Huebotter, portrays an idealized business cycle as a sine wave of economic growth versus time. The small gray areas at the ends of the curve indicate recessionary periods.
Knowing what the economic indicators are saying can help investors be in the right sectors at the right times.
Economic Indicators to Watch
To spot the next growth areas in the stock market and sell stocks about to see a decline in their businesses, investors pay attention to a variety of economic indicators. In addition to GDP, Unemployment, and the CPI, there are several other economic indicators that are important to investors.
How consumers feel is measured by The Conference Board Consumer Confidence Index. Based on a survey of 5,000 households, the index provides insight into how optimistic or pessimistic the typical family is about the economy. Feeling good about the future is very important to spending, and changes in this index are closely watched to see which industries will do well six months from now. Increased confidence should lead to more sales at high-end and trendy stores while a decline will benefit discount retailers who sell everyday items at lower prices in bulk.
Online employment ads are reported by several sources. The Monster Employment Index tracks jobs listed at monster.com, one of the largest online jobs sites. It is an important indicator of economic activity, offering insight into the degree of unemployment about three months ahead. Decreases in online ads means that companies aren’t hiring and therefore consumers will be reducing spending. Like consumer confidence, it is a leading indicator of economic activity. The government-supplied monthly unemployment report is a lagging indicator since unemployment will peak after the economy bottoms.
Money supply, at one time, was the most important economic indicator followed by stock traders. It is released every Thursday at 4:30 Eastern time by the Federal Reserve Board. In the time before 24-hour trading, this allowed market participants time to digest the data and avoided panic situations. Money is the lifeblood of the economy, and money supply measures the amount of cash in circulation and available for investments. Slow but steady growth is important to the economy. Too little cash means not enough will be available for investments and the economy may slow; too much is inflationary and will lead to higher interest rates which will slow the economy. This indicator has become less important since the use of other sources of financing, like derivatives, has become available but it is still important to monitor how fast money supply is growing to develop sound inflation expectation.
The Institute for Supply Management (ISM) Manufacturing Report on Business is probably the most important economic report investors have never heard of. Many economists watch it closely because they consider it to be a highly reliable near-term economic barometer. Data is available since 1931, and this monthly survey of business professionals offers valuable insights into the current state of the economy. The Purchasing Managers Index, the most widely followed part of the reports, has been shown to explain about 60 percent of the annual variation in GDP, with a margin of error that averaged less than half of one percent, a truly remarkable performance for an economic indicator.
The ISM Report is issued on the first business day of every month. One of the most important components of the report is the New Orders Index, which has one of the best track records of any economic indicator at forecasting the state of the economy six months ahead. The report also offers details on price pressures within individual industries, an extremely valuable input into the investment process.
Conclusion
The most famous equation in economics is MV = PQ. This means that the supply of money (M) times how fast that money is spent (velocity or V) is equal to the price level of money, most commonly thought of as inflation (P in the formula) times the GDP (Q). There are economic indicators which allow investors to monitor each of those key variables. And understanding that equation makes it easy to see how increasing the money supply too much will increase inflation and impact GDP. Knowing this relationship, for example, will help investors know whether or not it is a good time to invest in gold stocks, a traditional beneficiary of high inflation.
While short-term price movements in the US stock market seem to be almost random, the very long-term trend is up. This reflects the constant growth of the nation’s economy. Following economic news reports can give investors a valuable jump on the stock market.


