Spikes in the price of oil triggered recessions in the 1970s and again in 1990. However, these points are historical anomalies. It wasn't the price spike that caused the recession. Global geopolitical events underlying the price moves caused the recessions. In both examples, the details of the story held important information that couldn't fit into a headline.
News headlines can often trigger sharp moves in the stock market. Usually, it is the headline that creates the reaction as traders and high-frequency trading firms try to anticipate what is in the story.
For example, the monthly employment report starts with a headline about the number of jobs created or the current unemployment rate. Some traders scramble to buy or sell while others read the report. In early December, the full report was 39 pages long and analysts who read the entire report saw details that headline writers missed. This is often the case, and those details are the reason that sharp market moves driven by news are often reversed.
Stocks are not the only market where news drives prices. Commodities like oil also see immediate reactions to headlines. A detailed understanding of news in the oil markets can take several days to sink in, and over time, the immediate reactions seen in oil prices are often found to be overdone.
In the oil markets, the headlines have largely been about supply. Fracking is leading to increased supply in the U.S. as the country moves toward energy independence. In the Middle East, easing of sanctions against Iran could allow that country to return to the international oil market as Libya and Iraq return to normal levels of production.
Less noticed is news on the demand side. Demand for oil increases when the pace of economic activity increases. In the U.S., a slow but steady expansion is taking place. Europe appears to be finally exiting a recession. Emerging market economies like India and China are growing, and even though their pace of expansion is slower than in previous years, their growth is still rapid when compared to the developed economies in the U.S. and Europe.
This growth is fueling increased demand for oil. After studying growth forecasts, the International Energy Administration (IEA) recently estimated that worldwide demand for oil will increase about 1.3% in 2014.
The IEA's forecast seems to be in line with what oil producers believe. We can see how bullish or bearish market participants are in the futures market using data provided by the Commodity Futures Trading Commission. The weekly Commitment of Traders (COT) report shows how much producers in the market (known as commercials) and hedge funds (known as speculators) are buying and selling.
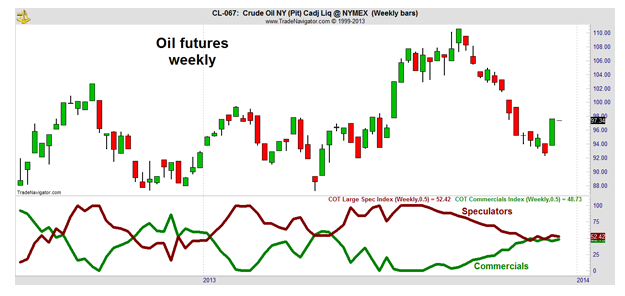
The chart below converts the raw data in that report into an index that places the current data in a range between 0 and 100 with high values being bullish and low values being bearish. The direction of the index also highlights long-term sentiment shifts among the key players in the futures markets.

Commercials (the green line at the bottom of the chart) are increasingly bullish on oil while speculators (the red line) are becoming increasingly bearish. Commercials tend to know the market best, and their bullishness is usually accompanied by rising prices. Speculators include large hedge funds. As a group, hedge funds tend to underperform the markets over the long term.
My 26-week rate of change (ROC) system continues to rate oil a buy and is holding iPath S&P GSCI Crude Oil TR Index ETN (NYSE: OIL), an exchange-traded note that can benefit from higher oil prices. An ETN is similar to an ETF except that ETFs hold stocks while ETNs hold futures. ETNs are probably the simplest way for individual investors to access futures markets.


