What is New Highs/New Lows?
As the name implies, new highs/new lows represents the number of all stocks making new 52-week highs or lows. The result is graphed, and the aggregate number of new highs and new lows is used as a market timing tool.
How Does New Highs/New Lows Work?
The graph of new highs/new lows is usually plotted against a major stock index, such as the NYSE Composite, which represents the broadest measure of activity on the New York Stock Exchange. Investors study this tool and decide whether the new high/new low picture is confirming or diverging from the underlying price action.
Confirmation occurs when both the underlying stock average and the new high/new low figures are moving together. This means whenever the market is making a new high, the amount of 52-week highs is rising as well. This demonstrates that most of the market is marching together, and the market as a whole is technically healthy. Confirmation for a bearish scenario follows the same guidelines, only there is an increasing amount of 52-week lows as the market continues its downtrend.
Bullish or bearish divergence can occur in one of two ways. At a top, bearish divergence can be signaled if the market reaches a new peak while the number of new highs is equal to or less than the previous new highs figure.
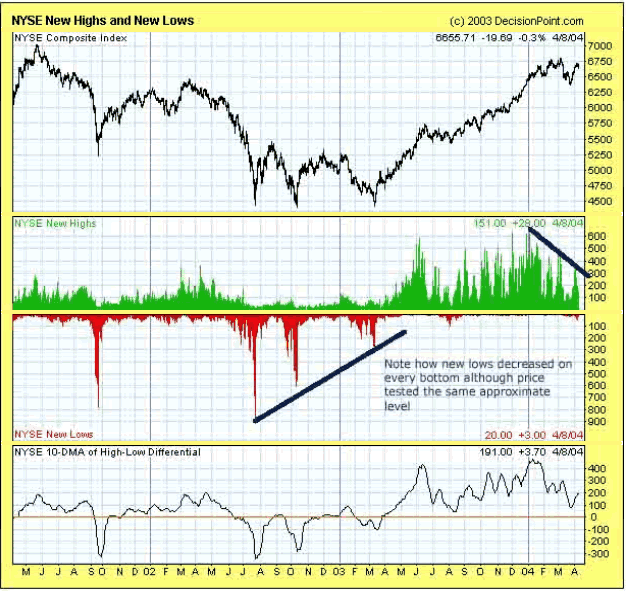
Bullish divergence happens when an index attains a new low, but there are fewer stocks hitting new lows than when the index previously valleyed.
The chart below shows an instance of bullish divergence. Notice that while the market kept hitting its lows, the amount of stocks hitting 52-week lows decreased. Soon after, the market gained traction and hit fresh highs.

Why Does New Highs/New Lows Matter?
Comparing the number of new highs/new lows to the behavior of a major stock average can reveal a side of the market that typically goes unnoticed by the financial press or casual observers. By looking beneath the surface, bearish divergence can often warn that the new highs hit by an index may not be sustained in the weeks ahead. Meanwhile, bullish divergence lets an investor know a market may soon rise. Furthermore, an increase in 52-week highs while the market is rallying gives confirmation to the new trend.


