What is Bearish Harami?
A bearish harami refers to a stock market trend indicating that the value of a stock is likely to experience a downwards, or bearish, momentum following a period of upward, bullish movement.
How Does Bearish Harami Work?
In technical analysis, stock market trends are calculated using a number of different methods. One such approach is known as the candlestick (or candlestick chart). This technique assesses a specific stock based on its highs and lows as well as its opening and closing prices each day over a certain period of time (usually six days).
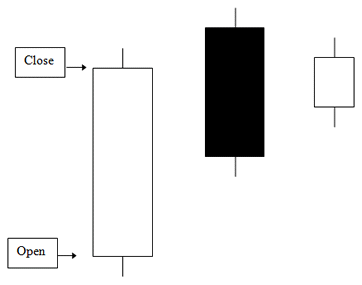
The bearish harami can be represented in the following manner:

If the body of the candlestick is white it indicates that the price of the stock closed higher than it opened, or gained value. A candlestick with a black body means that the stock opened higher than it closed, or lost value.
The wicks (or tails) represent the lowest and highest prices for the day.
The flat ends of the candlestick represent the opening and closing prices for the day.
In the black candlestick, the opening and closing prices would be reversed.
In a bearish harami, the second candlestick is positioned within the upper range of the larger, first candlestick. Either of the first two candlesticks may be either black or white.
A downward trend is indicated by a shrunken second candlestick, meaning that the previous high and lows, as well as opening and closing prices are experiencing a reversal of the previous trend. The third candlestick represents the trend on the following day's trading.
Why Does Bearish Harami Matter?
The bearish harami may represent the beginning of a trend, but it may only signal a temporary price fluctuation. Investors are usually advised to look closely at the price movements on the following days in order to verify whether a bearish trend is actually in progress.


