

What Is Break Even Analysis?
Break even analysis is a calculation of the quantity sold which generates enough revenues to equal expenses. In securities trading, the meaning of break even analysis is the point at which gains are equal to losses.
Another definition of break even analysis is the examination and calculation of the margin of safety that’s based on a company’s revenue – as well as the related costs of running the organization.

How Is Break Even Analysis Used?
A break-even analysis helps business owners determine when they'll begin to turn a profit, which can help them better price their products. Usually, management uses this metric to help guide strategic decisions to grow/maintain the business.
Break-Even Analysis vs. Break-Even Point
Break-even analysis uses a calculation called the break even point (BEP) which provides a dynamic overview of the relationships among revenues, costs, and profits. More specifically, it looks at a company’s fixed costs in relation to profits that are earned from each unit sold.
Break Even Analysis Varies Among Industries
Typical variable and fixed costs differ widely among industries. This is why comparison of break-even points is generally most meaningful among companies within the same industry. The definition of a 'high' or 'low' break-even point should be made within this context.
Break Even Analysis Formula
The following formula can be used to calculate the number of units that a business needs to sell in order to break even:

Fixed Costs
Fixed costs do not change with the quantity of output. In other words, they’re not affected by sales. Examples include rent and insurance premiums, as well as fees paid for marketing or loan payments.
Variable Costs
Variable costs change depending on the amount of output. Examples include raw materials and labor that are directly involved in a company's manufacturing process.
Contribution Margin
The contribution margin is the amount remaining (i.e. the excess) after total variable costs are deducted from a product’s selling price.
Say that an item sells for $5,000 and your total variable costs are $3,000 per unit. Your contribution margin would be $2,000 (after subtracting $3,000 from $5,000). This is the revenue that’ll be used to cover your fixed costs – which isn’t considered when calculating the contribution margin.
Earned Profit
Earned profit is the amount a business earns after taking into account all expenses. You can calculate this number by subtracting the costs that go into your company’s operations from your sales.
Example of Break Even Analysis
In this break even analysis sample, Restaurant ABC only sells pepperoni pizza. Its variable expenses for each pizza include:
Flour: $0.50
Yeast: $0.05
Water: $0.01
Cheese: $3.00
Pepperoni: $2.00
Adding all of these costs together, we determine that it has $5.56 in variable costs per pizza. Based on the total variable expenses per pizza, Restaurant ABC must price its pizzas at $5.56 or higher to cover those costs.
The fixed expenses per month include:
Labor: $1,500
Rent: $3,000
Insurance: $200
Advertising: $500
Utilities: $450
In total, Restaurant ABC's fixed costs are $5,650.
Let’s say that each pizza is sold for $10.00. Therefore the contribution margin is $4.44 ($10.00 - $5.56).
To determine the number of pizzas (or units) Restaurant ABC needs to sell, take its fixed costs and divide them by the contribution margin:
$5,650 ÷ $4.44 = 1,272.5
This means the restaurant needs to sell at least 1,272.53 pizzas (rounded up to 1,273 whole pizzas), to cover its monthly fixed costs. Or, the restaurant needs to have at least $12,730 in sales (1,272.5 x $10) to reach the break-even point.
Note: If your product must be sold as whole units, you should always round up to find the break-even point.
Remember: Fixed Costs Can Increase
Some fixed costs increase after a certain level of revenue is reached. For example, if Restaurant ABC begins selling 5,000 pizzas per month – rather than 2,000 – it might need to hire a second manager, thus increasing labor costs.
Break-Even Analysis Benefits
Break-even analysis is a great way to determine a business’ profitability. It can show business owners and management how many units need to be sold in order to cover both fixed and variable expenses. It also provides a specific benchmark or goal so businesses not only survive but also remain profitable.
Calculating Break Even Analysis in Excel
Excel users can utilize Goal Seek (a tool that’s built into the program) to calculate a break-even rate. To do this, you’ll need to have an Excel break-even calculator set up:
Step 1: Find Goal Seek
Go to DATA → What-if Analysis → Goal Seek

Step 2: Enter Your Numbers Into the Break Even Point
In the inputs, enter:
Set Cell = Contribution Margin Per Unit($I$12);
To Value = 0;
By Changing Sells = $B$30 i.e. How many units do you want to sell (see blue arrows).
This tells Excel that you want to find the number of units that you will need to sell to break even. Click “Ok” and Excel will do the work for you.

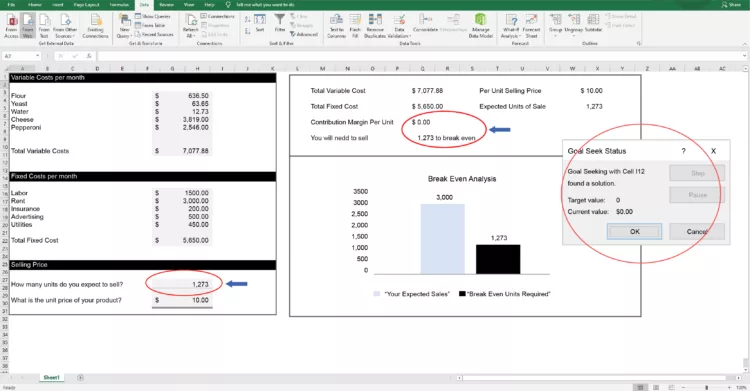
Step 3: Review the Number of Units Required to Break Even
Excel will automatically populate the required number of units to ensure that Contribution Margin is $0.
If you are ok with the result, then click 'ok' in the Goal Seek Status box and Excel will leave the breakeven number of units in place. If you click 'Cancel', Excel will revert back to what you had previously in those cells.
Optional: Create A Scenario Simulator for Multiple Units of Sale
If you want to see profitability based on many sales figures, then a scenario simulator may be helpful.
To do this, In Excel, go to: DATA → What-if Scenario → Scenario Manager. Here, you can input multiple scenarios with different sales units.
IA has recreated 3 scenarios as a starting point(Recession = 1000 Units; Normal = 1500 Units; Boom= 2000 Units)

To add a scenario, click “ADD,” provide a name (in this instance, “Example”), and make sure that the changing cell includes the number of units you want to change. Click “Ok.”

Excel will then ask you to enter how many units you want this scenario to contain. In this instance, it is 3000 units. Click “Ok.”

If you click on a scenario and click “SHOW,” Excel will automatically update the expected sales figure and calculate the contribution margin. In the following screenshot, the chosen Example scenario has 3000 units:

To view all your scenarios simultaneously, click on “Summary.” Excel will ask you which resulting cell you want to see. In order to see “Contribution Margin Per Unit,” our example set that to cell $I$12 and Excel inserted a new tab which shows the scenarios ($B$30 is our units of expected sale) plus the associated Contribution Margin Per Unit ($I1$12).


